![]()
Greetings, fellow data analysts!
Controllers and honest journalists both share a yearning for the truth. One-sided reporting, however, can mean trouble for some and prestige for others. The German Press Council, for example, doesn’t appreciate it at all. If it feels that a publication has breached its codex, it has the right to reprimand it. In 2007, it did so 35 times (for various reasons; sparkline begins in 1997). In companies, however, the supervisory board and other report consumers are grateful when they receive a report that contains all relevant business data and background information – even more so when they include an insightful comment or are summarized on a single page or computer screen. How often a controller has received well-deserved praise for that (or other reasons), however, is unknown.
Creating a “one page only” reporting standard may be challenging for controllers as far as content is concerned. Thanks to DeltaMaster, however, the crafting is not. Using a clever combination of pivot tables, Flexreports and combination cockpits, report authors can present complex scenarios in a compact manner. In addition, they can shed light on various aspects of the material by combining these versatile reports on a single page. In this edition of clicks!, we will introduce one tried-and-true method to create these types of reports.
Best regards,
Your Bissantz & Company Team
Many report consumers wish that they could see everything that is important at a glance – either on a single piece of paper or computer screen. For many report authors, creating a one-page report is very challenging. In addition to combining various measures from different areas of the company, they also have to present this information as a central view in a way that looks good as well.
With DeltaMaster, you can create these types of solutions systematically. In this edition of clicks!, we will explain one of many tried-and-true best practices.
Power in numbers
The idea is to create the desired report using three different types of cockpits: pivot tables, Flexreports and combination cockpits. In doing so, the individual strengths of the three different cockpit types shine through.
- Pivot tables form the foundation of the report and show which data should be displayed. Generally speaking, you usually define measures, dimensions, rankings, filters, etc. in pivot tables.
- Flexreports are used for more detailed formatting in cells and cell areas. You can also use them to access individual values, for example, in order to create special calculations. The data stem from one or more pivot tables or other Flexreports via cell references.
- Combination cockpits place the formatted visualizations next to each other to illustrate different aspects of the reported subject matter. You could also integrate analysis templates, unformatted pivot tables, headlines and other elements into these cockpits.
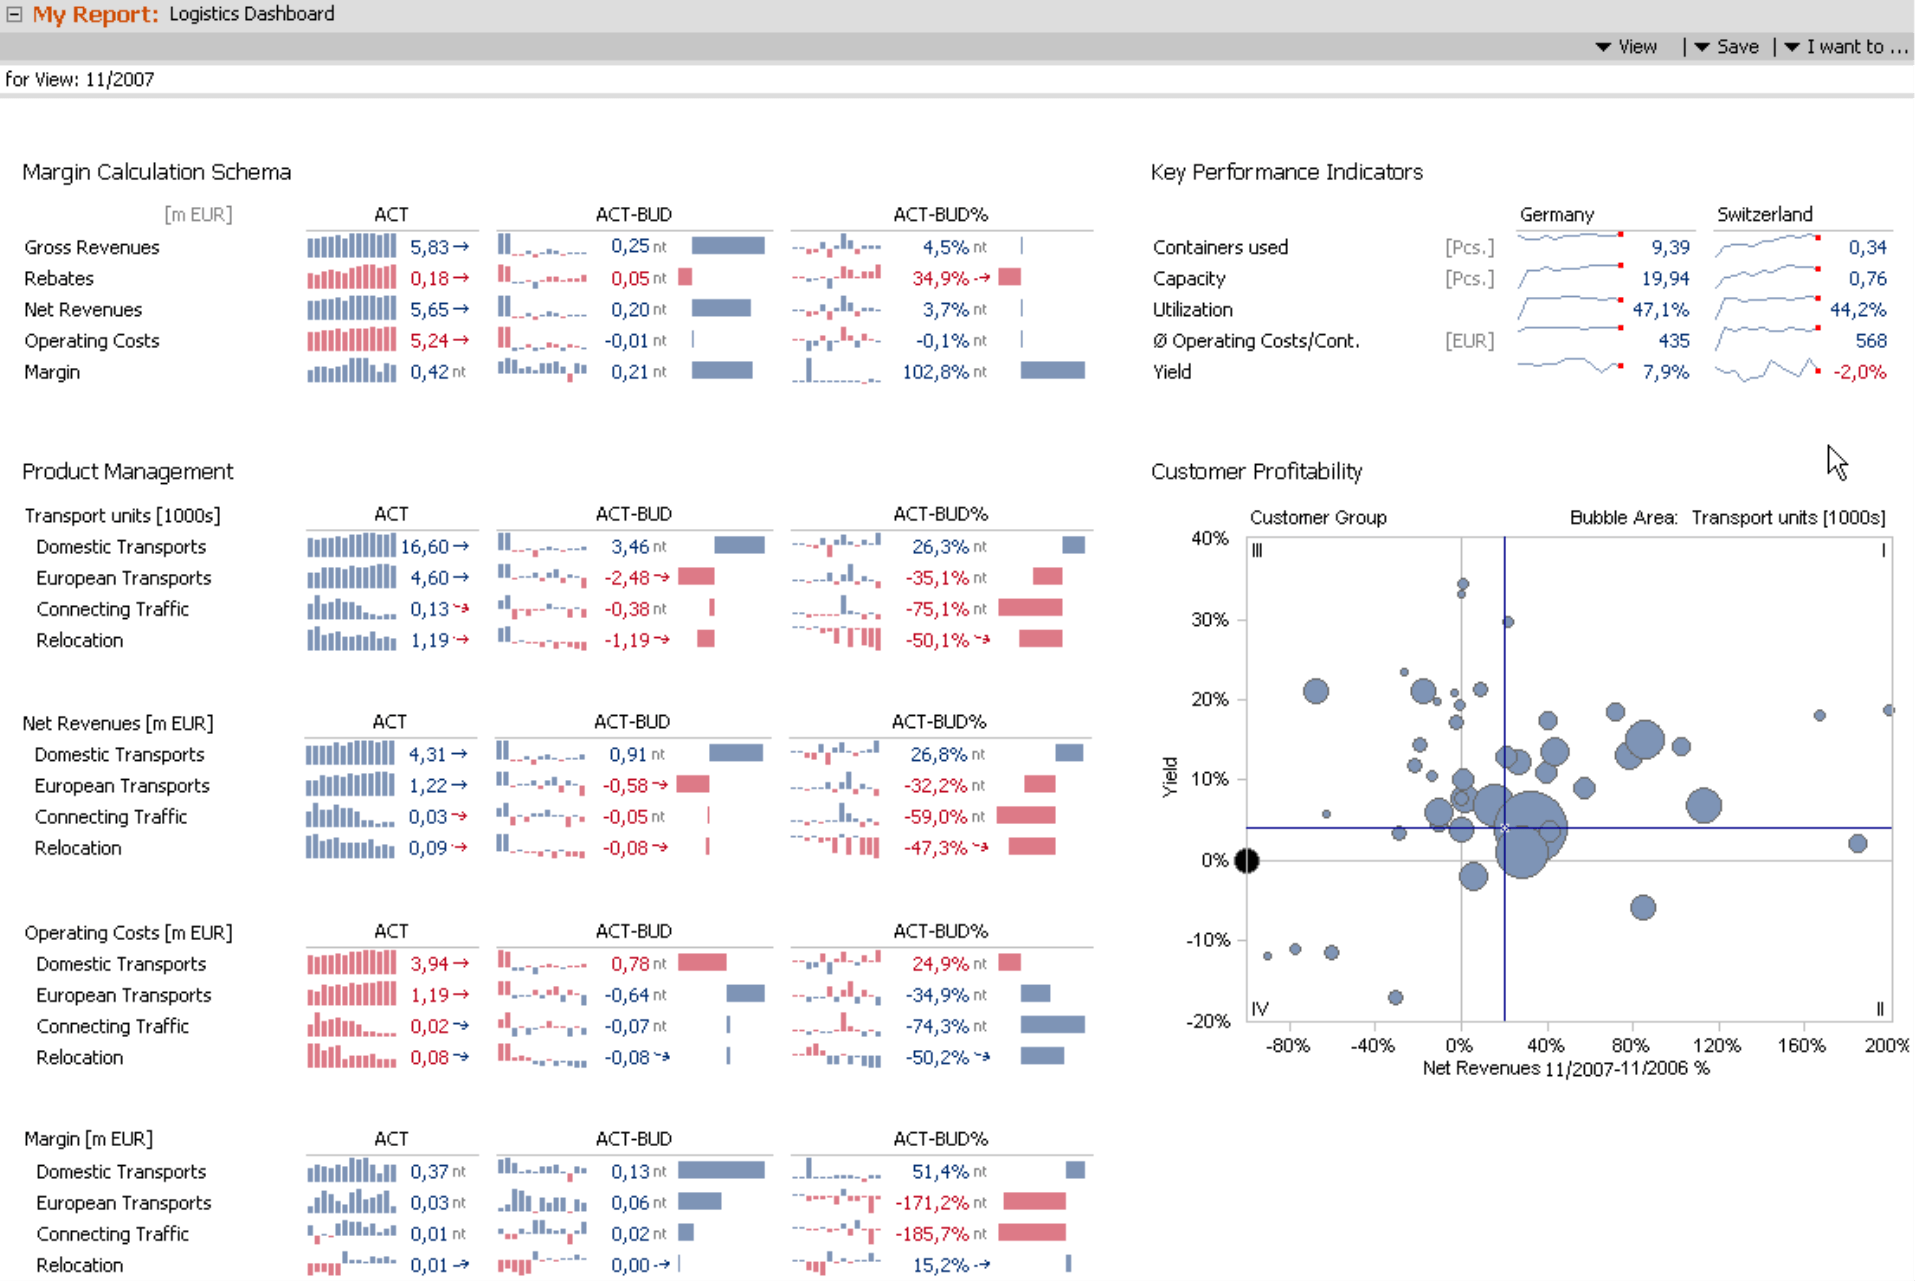
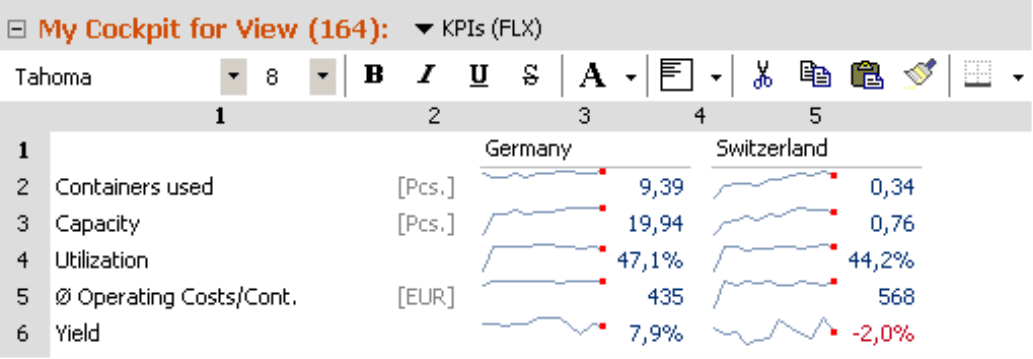
By following these three steps, you can create information-dense reports in a very efficient manner. One example is the dashboard for a logistics company on the previous page. The entire report is a combination cockpit that contains seven report elements: six Flexreports and one analysis template, the portfolio on the right-hand side. The Flexreports, in turn, are each based on a pivot table. They provide information about many different aspects of the business including margins, transport volume and operating costs. Column sparklines illustrate the development over time, while the bars in DeltaMaster notation visualize the relative size of the budget variances. The headlines were added as text into the combination cockpit.
The following sections will explain how this combination cockpit was built. For the sake of simplicity, we will concentrate on the “Key Performance Indicators” section on the upper right-hand side.
Step 1: Pivot tables – base data
As a first step, you need to determine which data you want to display. This is a job for a pivot table. In addition to supplying data, this powerful tool also simplifies report formatting and design later in the process.
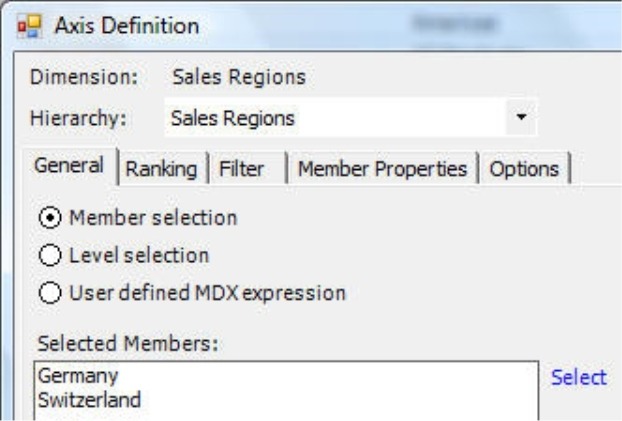
- In the Axis definition you define the member results for rankings and filters. These settings also apply for Flexreports that reference the pivot table. Therefore, if your pre-selection here is close to what you want to display at the end, you can minimize the remaining work later on.
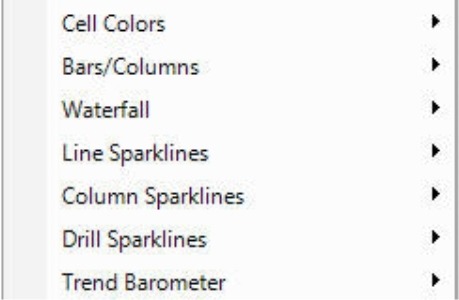
- Graphical table options (e.g. sparklines, bars, columns, waterfall or cell colors) that are activated in the pivot table will be inherited when they are converted into a Flexreport with cell references. If you make changes afterwards, however, these must also be manually changed in the Flexreport.
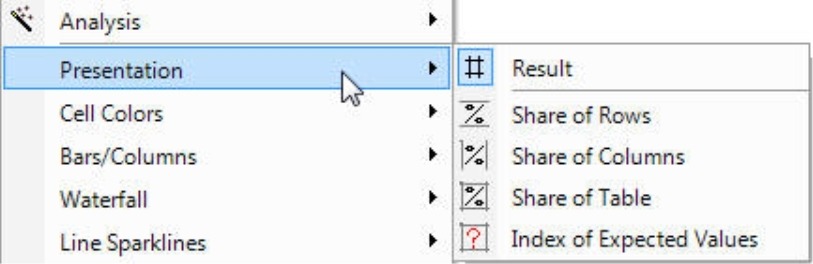
- Depending on which Presentationoption (context menu) you choose, DeltaMaster will either show the Results of the database query or percentage views. These views are particularly useful when you need to display percentages of the total sum on a broad scale. To learn more about this feature, please refer to DeltaMaster clicks! 07/2008, page 6.
Once you have built a pivot table that reflects your needs, save it as a cockpit.
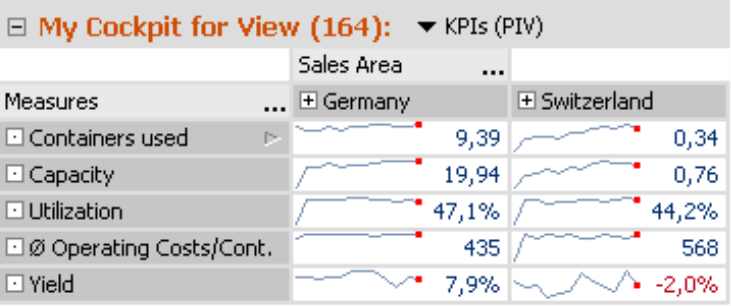
Our sample table on the right is very simple. It contains a selection of measures and the “Sales Area” dimension. From the various options for cell visualizations, we have only activated line sparklines.
Step 2: Flexreport – Formatting and accessing individual values and cells
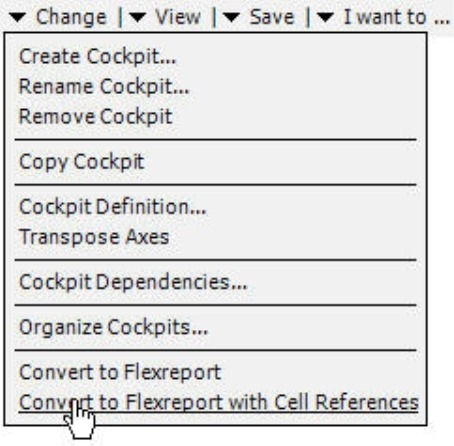
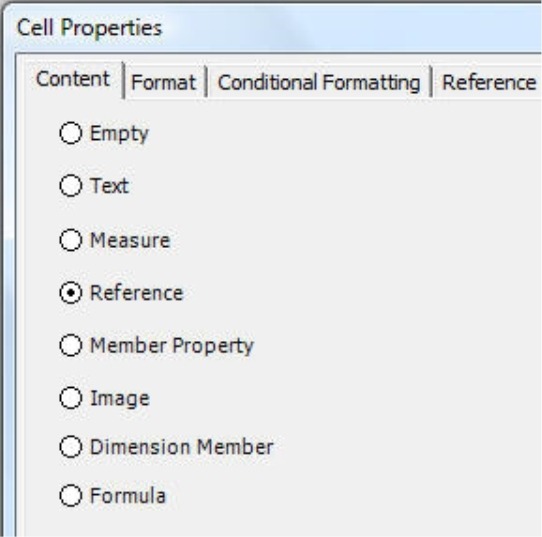
Next, you create an additional cockpit from your pivot table by selecting the Convert to Flexreport with cell references option in the Change menu. In the derived Flexreport, each cell’s Content contains a Reference to the underlying pivot cockpit. As a result, structural changes in the pivot cockpit are immediately visible in the Flexreport cells.
Theoretically, you could also convert the Flexreport without cell references. In this scenario, however, it makes little sense because it would generate a measure (filter value) for each cell and enter these directly into the cells of the Flexreport.
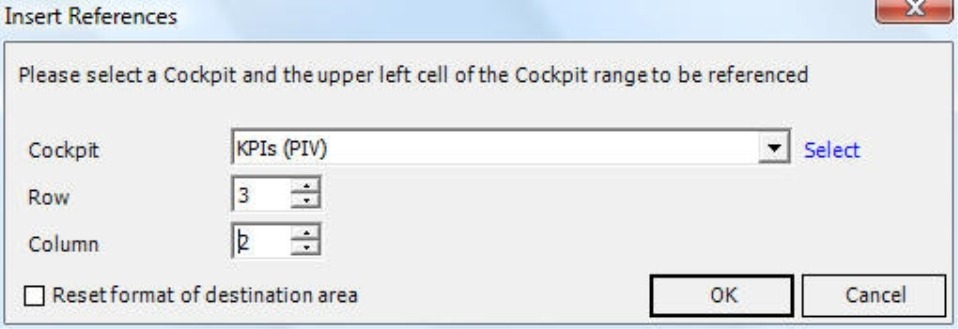
If you enter references into the cells of an existing report (e.g. to reuse the work from a pivot table or another Flexreport), highlight the appropriate cells in the Flexreport and select the Insert references command in the context menu. Now select the desired cockpit and the upper-left cell of the cell area that you want to reference. Using this feature, you can grab values from several cockpits and present them in one Flexreport. For added assistance, you can display the Cell coordinates of the source cockpits (context menu, I want to… menu) in both pivot tables and Flexreports.
Under Cell properties (context menu) you can also find many other options to fine tune the content or the appearance of the cells. For example, you could define individual sparklines for each cell; the simpler and faster alternative, however, would be to reference them from a pivot table. Some special sparkline types such as those defined in MDX can only be created in a Flexreport.
You could also create calculations with the help of Formulas – just as you would in a spreadsheet. If you want to reuse this formula in the Flexreport or elsewhere in your DeltaMaster application, however, the better alternative would probably be to create a calculated member, user-defined measure or special pivot table instead.
In our logistics example on your right, we chose a Flexreport solely because of its formatting options. Here, we removed the frames from the pivot table, made the headline spacing more narrow, and added a column for the units. You can activate the Toolbar in the upper corner from the context menu or the I want to… menu.
Step 3: Combination cockpits – pivot tables, Flexreports and analysis templates in one
In the combination cockpit we can now merge the different cockpits and analysis templates into a single report. Since we described this process in detail back in DeltaMaster clicks! 12/2005, we will simply recap the most important steps.
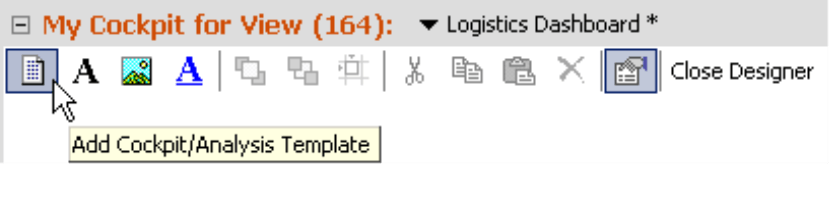
In the “Designer” or edit mode, the cockpit is initially displayed as an empty workspace with a toolbar in the upper corner. Add cockpit/analysis template, the most important button, is located on your left. Activate the function and then drag open a box at the desired location.
Now you will see a selection window where you can determine which cockpit or template should appear inside the box. On the lower part of the dialog box, you can choose from the available analysis templates. Not familiar with the functionality of these templates? Just as a cockpit saves the properties and definitions from the My cockpit window, an analysis template stores the parameters of the analytic methods in the My analysis window and dynamically uses them in the cockpit based on the current view. As a result, the dialog box shows two different selection lists. Once you chose an analytic method, DeltaMaster will display which templates are available.
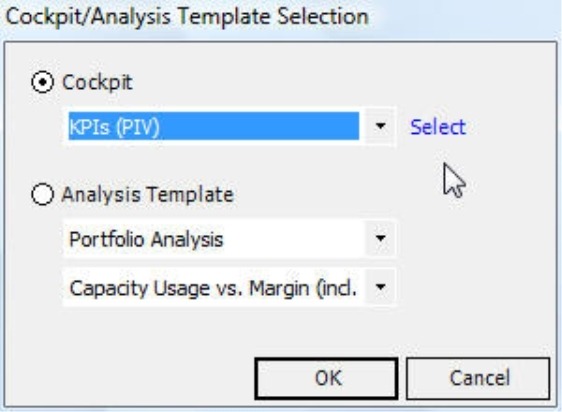
In our example, we incorporated a portfolio presentation with the help of an analysis template.
And so on…
The resulting combination acts just as a cockpit would. You can, therefore, save it with a comment as a report in the DeltaMaster briefing book, view it in Reader mode or export it. The report adjusts to changes in the view. Since it also supports threaded analysis, Miner users can even grab a value and drop it into an analysis method for further investigation.
Questions? Comments?
Just contact your Bissantz team for more information!
