![]()
Greetings, fellow data analysts!
When someone talks about “user friendliness”, we generally think of some type of software or technical equipment that is easy to use. The German Automobile Association (ADAC) also uses this term to refer to parking garages. Since 1987, garage operators can take part in the “most user-friendly parking garage” contest and compete for the club’s certificate of recommendation. Since that time more than 200 garages have received this recognition. ADAC’s 130-point check list inspects every detail – including the walkway from the self-service pay station to the parking spaces.Today, most of us expect to find clearly identified parking levels so that we can easily relocate our cars on the way out. But how is it with management reports? Can we easily differentiate the different levels of our data models in a report? The level formats in DeltaMaster’s Flexreport make it easy to orient ourselves – and are user friendly as well. Find out more in this edition of clicks!.
Best regards,
Your Bissantz & Company Team
PS. Speaking of automobiles: If you want to know what we think of analogies between driving cars and companies in general, check out our blogs “Me, myself and BI“ and “Bella consults“.
In the last edition of DeltaMaster clicks! we introduced a concept for creating information-dense reports and cockpits. We implemented this customized formatting using a Flexreport, a cockpit type in Miner mode.
Postscript: Starting with the new DeltaMaster 5.3.6 release, you could eliminate this step in certain cases. Depending on the current user level (e.g. Reader and Viewer), DeltaMaster now can automatically present pivot tables in White style, a sleek, clean format that doesn’t use “chartjunk” like grids, background colors, etc. (see DeltaMaster deltas! 5.3.6, Feature #23).
If you have more advanced formatting requirements, however, the Flexreport has a wide range of helpful options. One of these features, which is called a Level format, allows you to automatically format the report based on the data that it contains.
The basics
Tables are both: the Flexreport and the pivot table. The pivot table is more or less a direct representation of a database query. All definitions and settings refer to the axes or the table as a whole. The individual cells, however, are a job for Flexreports. Flexreports are ideal for formatting because you can use them to address specific cells or cell areas. You could also use Flexreports for creating individual calculations with formulas, adding hyperlinks to other reports (see DeltaMaster clicks! 7/2007) or integrating images (see DeltaMaster clicks! 1/2007) – but we don’t want to go off track about their potential.
As a whole, a Flexreport focuses on cells. You can fill them with targeted content and determine their appearance.
Formatting cells
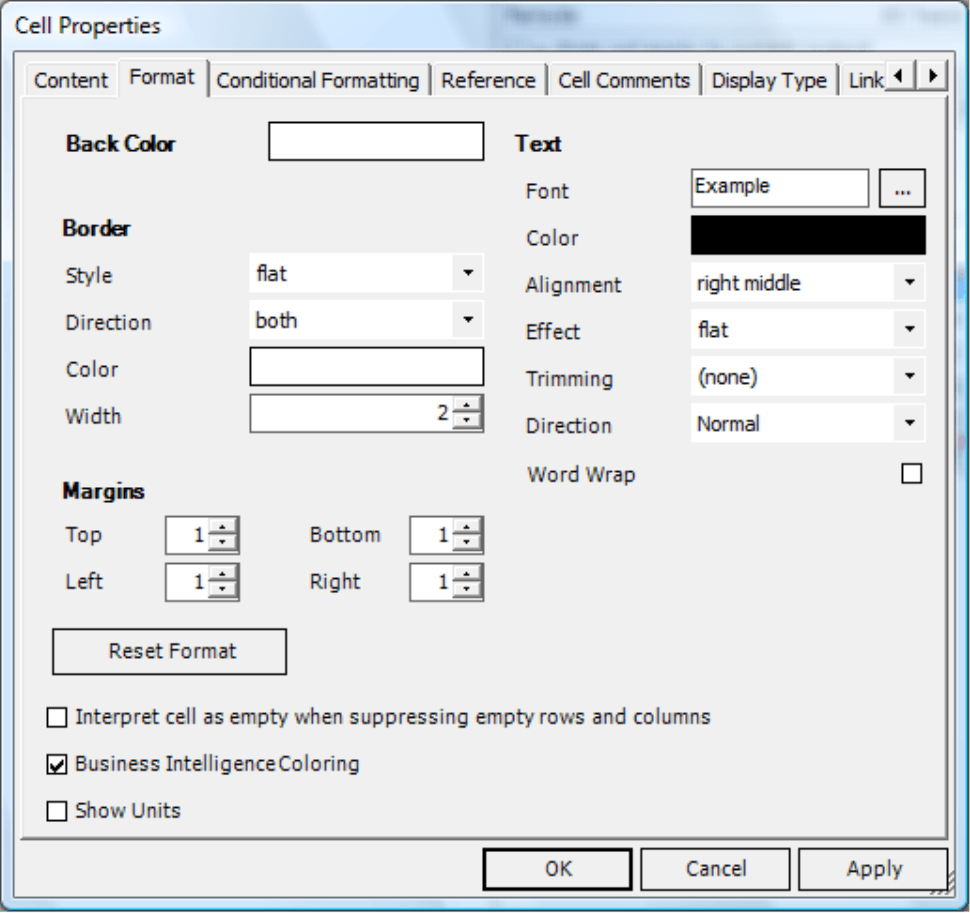
You can view and change all of the options for formatting cells in a Flexreport via the context menu: either in the Cell properties on the Format tab or in the Table properties on the Normal cells and Fixed cells tabs. You may also directly edit some of the cell properties in the Toolbar which you can display from the context menu or the I want to… menu.
Here you can determine the background color, the border presentation, the inner margins and the style for text or numbers.
Out of all the options, Trimming is probably the only one that should be new to you. This is only important when the column width is not automatically sized (Table properties). This field then manages how the text should be truncated if it is too wide for the cell. In the default setting, DeltaMaster displays the word until it hits the edge of the cell and then cuts off the rest. It can, however, also account for Characters or Words by cutting them off a bit earlier instead of chopping them in the middle of a character. To inform your readers that the text has been shortened, you can display an Ellipsis. If you choose the Ellipsis path option, DeltaMaster will save space in the middle rather than at the end of the text.
The format which is specified under Table properties applies for newly added rows and columns as well as all other cells that don’t have a specifically defined format. The format that is defined under Cell properties only applies for that particular cell.
Single versus level
Using these parameters, you can format a cell any way you would like. The defined format “sticks” to that cell, or more accurately, its coordinates.
Sometimes, however, it makes more sense when the format depends on the data itself – and not the cell’s location in the report. Here’s an example:
The screenshot on your right shows a Flexreport that takes its values using cell references to a pivot table. We have listed the period (February 2007) and report unit (1000 $).
The cells in row 9 are in bold type and report aggregates: total revenues and margin as well as the average profitability of all three main product groups. Since they are totals, they may well be accentuated and look different than the individual items.
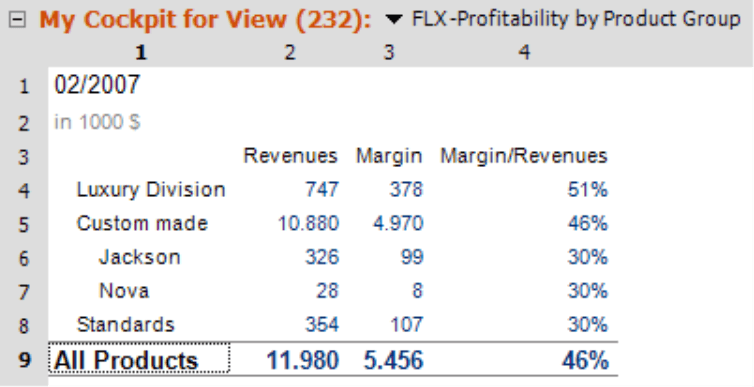
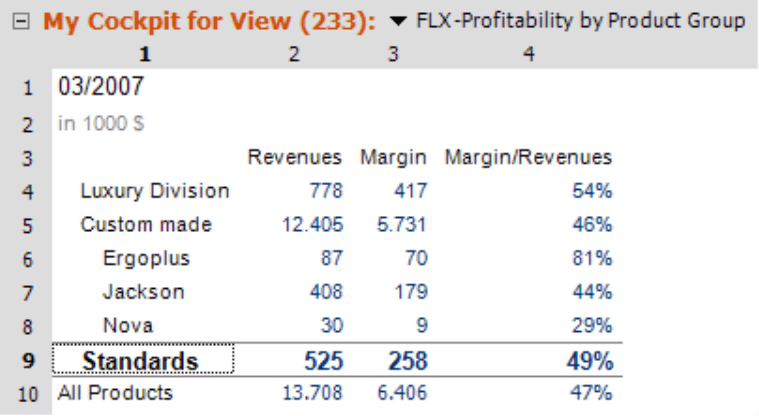
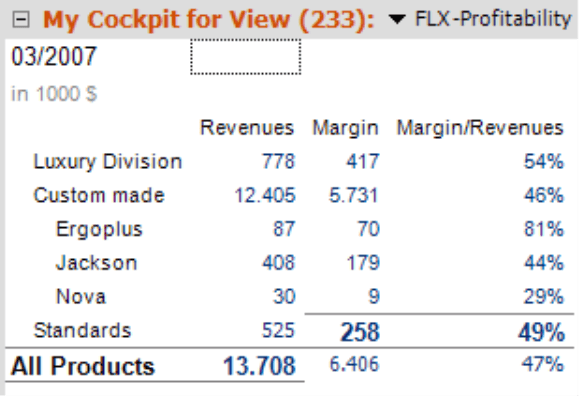
Now let’s switch the view from February to March 2007 as illustrated in the screenshot on your right. Row 9 is still bold, but it now shows “Standards” instead of the aggregated values. The reason is that the list of the “Custom made” models has grown in the underlying pivot table. In row 6, you can see the new “Ergoplus” model. This product line apparently did not generate any revenues in February and, therefore, was not included in this report. In March, however, it did. Since the table is larger, the sum is now positioned in row 10 instead of row 9. This shows that we weren’t on target with our formatting, because the point of our example was to highlight the total – not row 9 in general. And depending on the data at hand, the total may or may not be at this location.
This is where Level formats come into play. They determine how a cell should appear based on the hierarchy level in which the value is located. This format, in turn, automatically applies for all cells on this level.
Cell format as a template for the level format
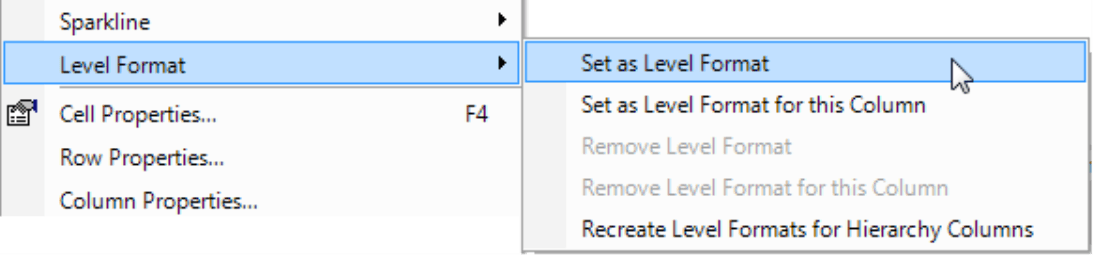
Using the level format is simple. You start by formatting any individual cell that contains a value on the level in question, (e. g. “total revenues” in row 9, column 2 of the screenshot on page 3). After you have created the desired formatting, you can choose the Set as level format option in the context menu. As a result, this format will now apply to all values that are on that level – regardless of how many times or in which row of the report they appear. Once you have set the level format, it is irrelevant from which cell you derived it.
Starting from the February 2007 view, let’s say you have highlighted the cells “All Products” as well as “11,980” (total revenues) and have set the level format for their respective columns in both cases. The screenshot on your right illustrates the effects. If you now change the view to March 2007, the format of the first two columns will apply for the aggregates just as you wanted. The other two aggregate cells still follow the coordinate-based format. You can, of course, convert the individual cell format into a level format for these two columns, too.
You can set level formats for one or all of the value columns in a table. You can also delete column-wide and table-wide level formats by selecting the respective function in the context menu. Here, it doesn’t matter on which cell you based the formatting. You can open the command for any cell in the desired hierarchy level and remove the level format from all cells. In this case, DeltaMaster will apply the default format which is defined in the cell and table properties to these cells (see below).
Hierarchy columns
In order to derive a level format from a cell, it must have Reference as the cell Content. This way, DeltaMaster can refer back to the linked pivot table and identify on which hierarchy level the value is. In addition, the hierarchy column must be available in the Flexreport. When converting a pivot table to a Flexreport with cell references (Change menu in the pivot table) DeltaMaster automatically transfers this information and presents it in the Flexreport. In our example, this would be column 1, which lists the main product groups. You could, however, also generate the hierarchy columns afterwards by highlighting a section of the Flexreport and Inserting references (context menu) to the hierarchy columns of a pivot table.
In case you lose the format in the (fixed) hierarchy columns, for instance after making some changes, you can select the Recreate level formats for hierarchy columns feature in the context menu to reapply the indentation from the underlying pivot table.
Due to the special meaning of a hierarchy column, level formats generated here are only applied to the respective column – they cannot extend to the entire table.
Priorities
We have seen that Table properties, Cell properties and Level formats all influence the appearance of a cell. When several of these visual options apply at the same time, the following rules will determine which one prevails:
- Conditional formatting (tab under Cell properties) has the highest rank. If the determined condition has been filled, DeltaMaster will apply the respective format and ignore any other cell, level or table-specific specifications.
- The format which is set for an individual cell has priority over level and table formats.
- Level formats defined for individual columns have a higher weight than level formats for entire tables.
- A level format defined for an entire table will overrule the format listed under Table properties.
Level formats are complementary. Format attributes that are defined in the table properties will be overruled by the respective specification in the level format. An individual cell format, however, will remain intact. DeltaMaster will not account for level formats, for example, if you use the copy/paste functions or the paint brush in your toolbar to transfer formats.
Questions? Comments?
Just contact your Bissantz team for more information!
