![]()
Greetings, fellow data analysts!
The year 2012, so they say, was a good year for many who invested (or simply played around) on the stock market. Germany’s blue-chip index, the DAX, and most of the companies on it, for instance, finished the year with solid gains over January. News stories like these are motivation for our work as well and have even triggered some of the articles in our blog. In order to build our arguments regarding the statements made or overall presentation, we make our own analyses and, if necessary, suggestions for improvement. In doing so, we follow a tried-and-true approach: We search for the cited data and load it into DeltaMaster so that we can analyze it easily and visualize it correctly.
Thanks to its integrated TableWizard and CubeWizard tools, it pays to use DeltaMaster to prepare and evaluate even small amounts of data. In this edition of DeltaMaster clicks!, we will walk you through an example how you can integrate and analyze the 2012 share prices of DAX companies in DeltaMaster. Only time will tell if this information alone can help you make wiser regarding your trading decisions in 2013. One thing, however, is certain – you can use these insights to intelligently analyze and visualize data in the new year and beyond.
Best regards,
Your Bissantz & Company team
DeltaMaster’s powerful analytic capabilities aren’t just for examining large quantities of information in a data warehouse. You can use it to analyze small amounts of data as well. Take, for instance, the Excel files or Access databases that you receive from customers or suppliers, have purchased from consultancies or market research institutes, or were put together by student trainees. You can also evaluate these types of information using the analytic methods and visualization forms in DeltaMaster.
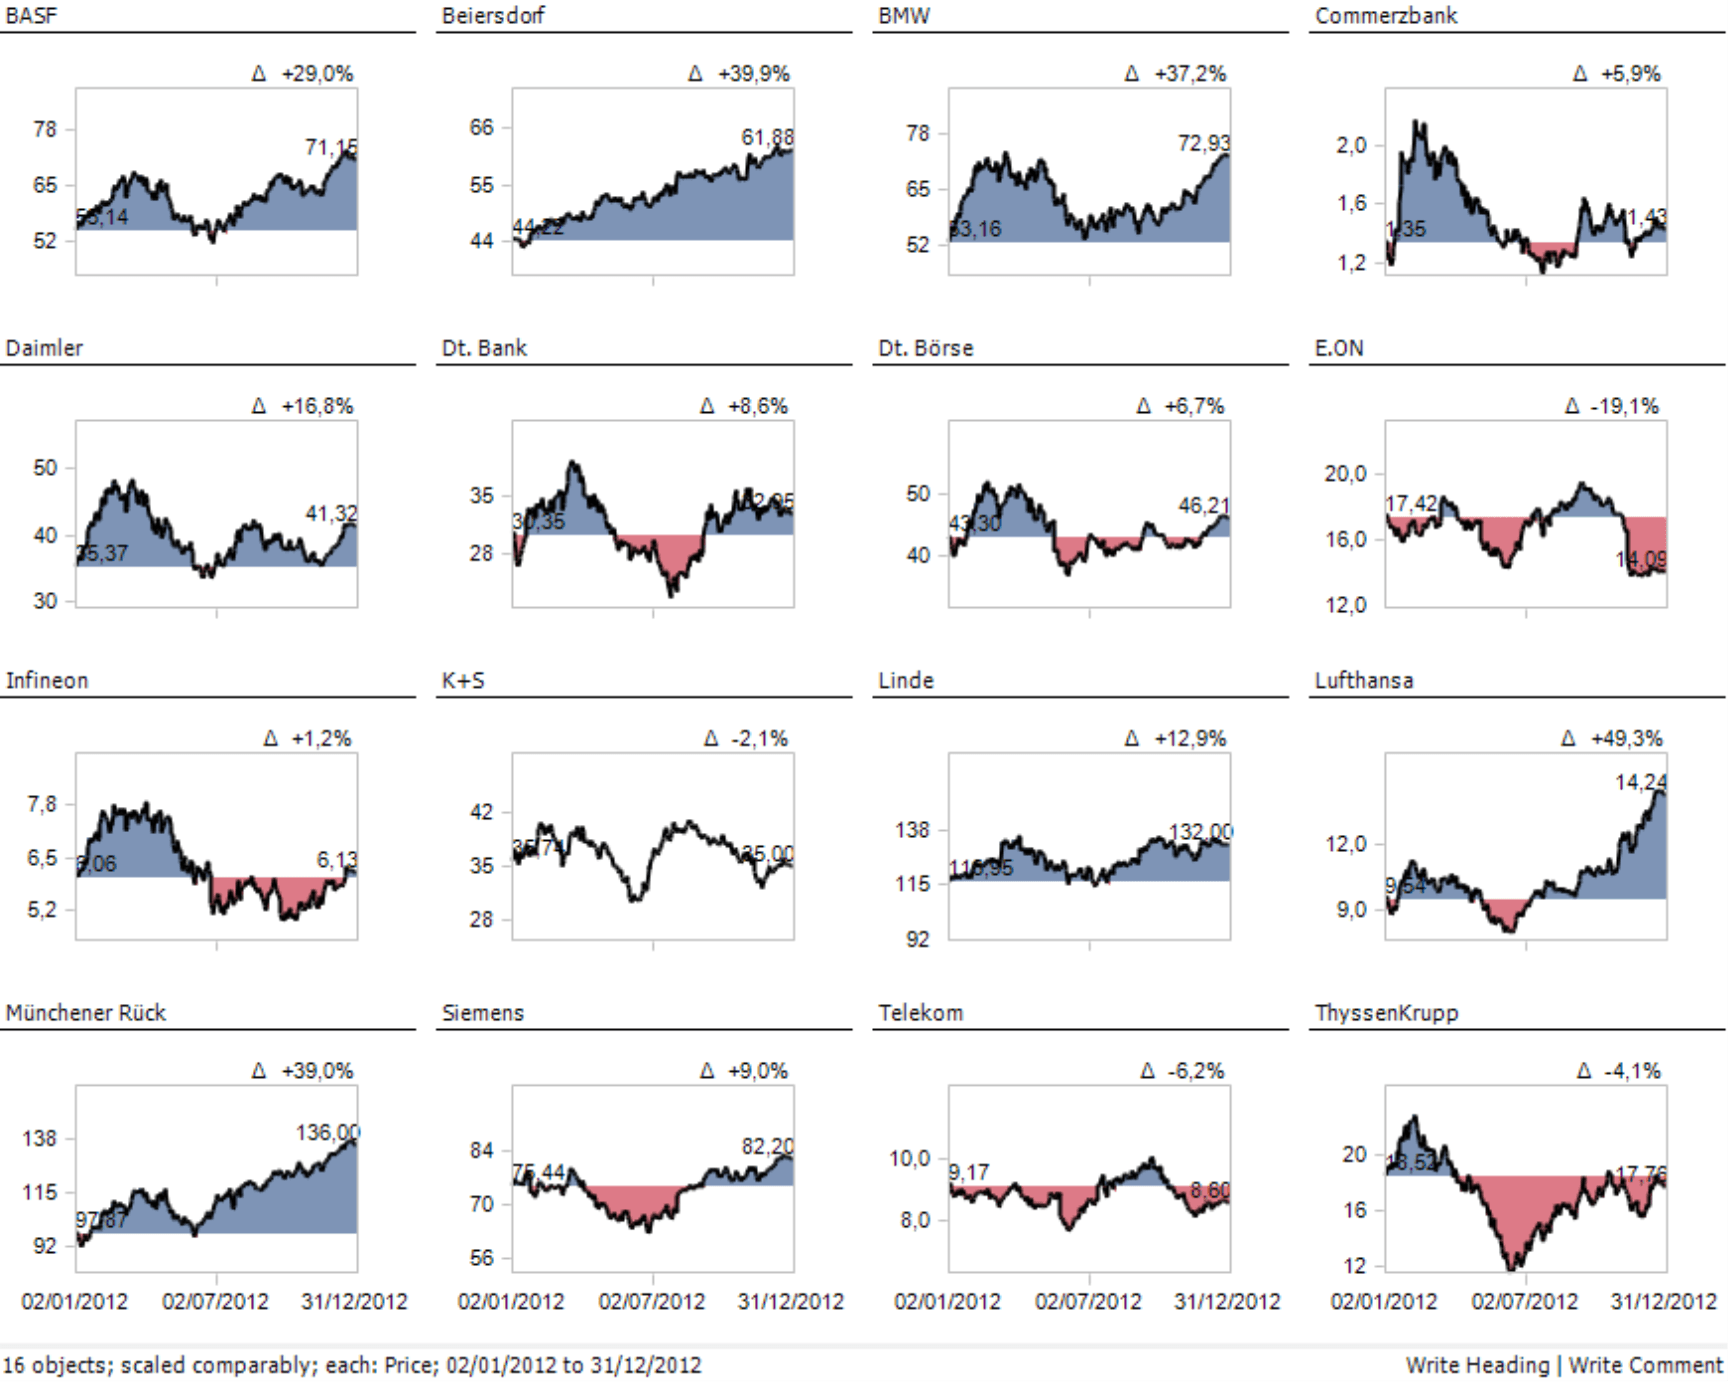
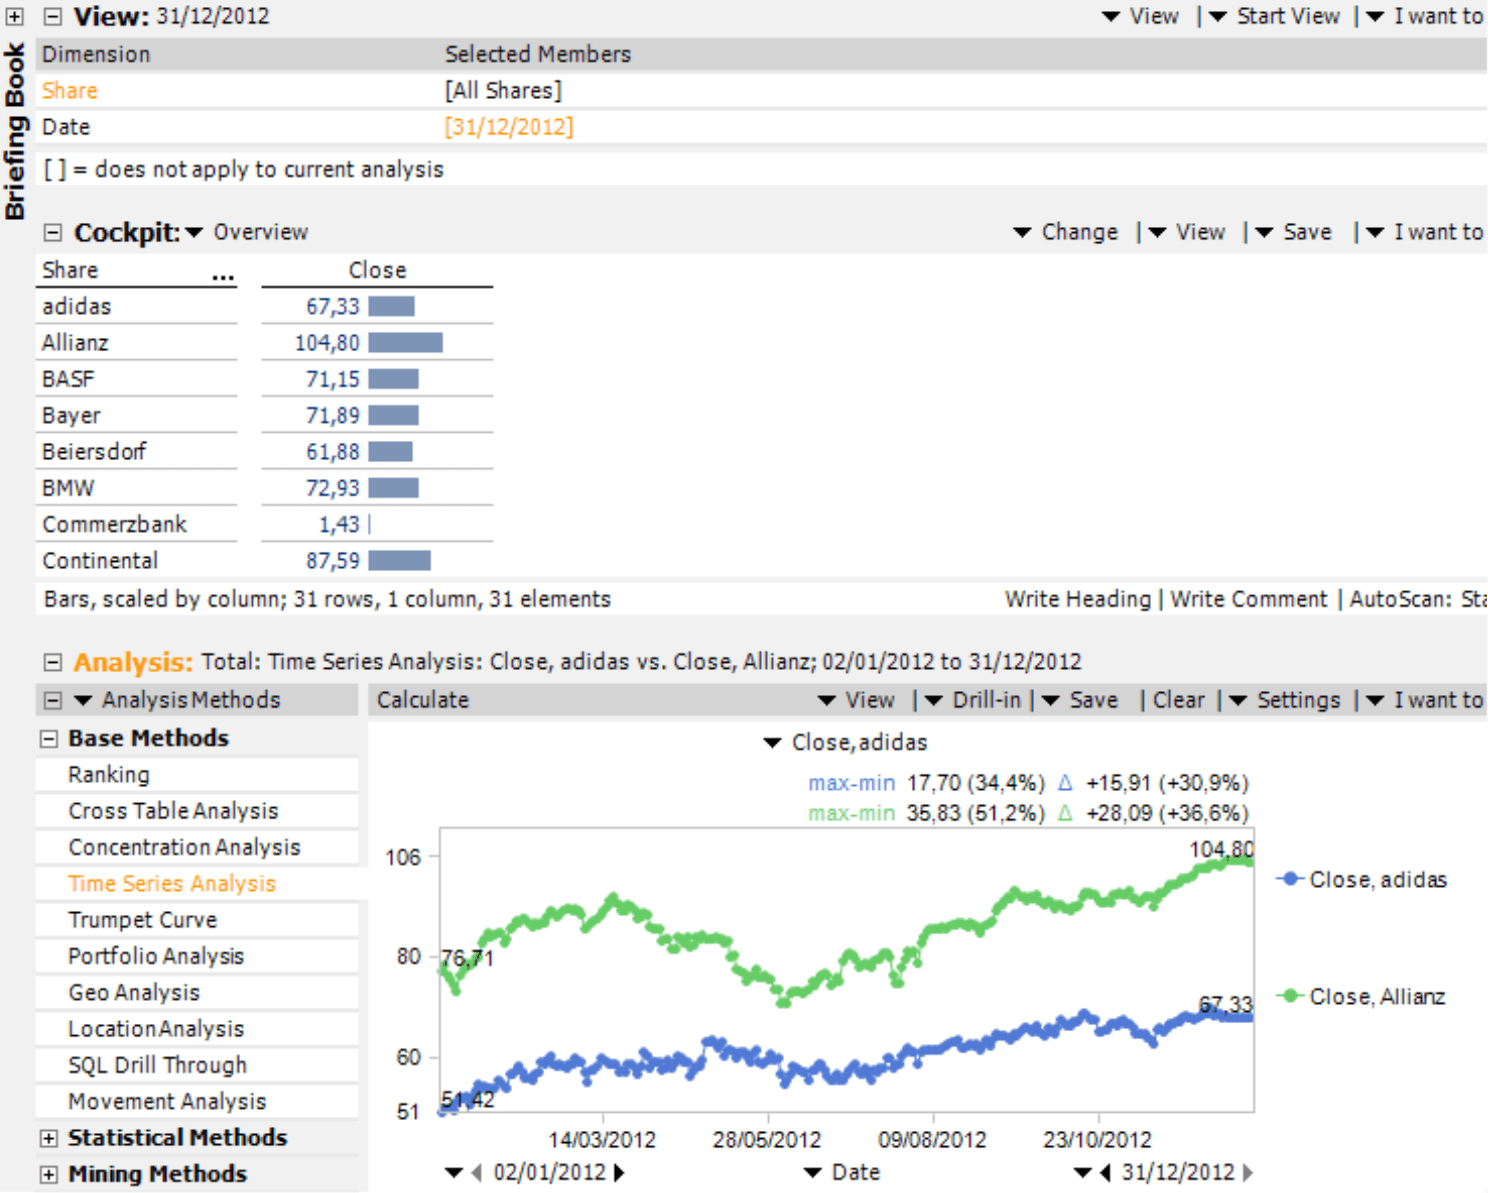
In this edition of clicks!, we will explain which steps you need to take and why it pays to use DeltaMaster for these types of tasks. For the dataset, we will use share prices. This data – including comparative values in the form of time series – is readily available in the Internet. Since we are also dealing with genuine data, you can discover relationships and trends that actually exist in the real world. In the following examples, our prime focus will be to explain the different steps of the process – from gathering data to creating reports such as the Small Multiples report below.
In doing so, we do not want to delve into special financial analyses. In our descriptions of DeltaMaster, we will focus on providing a bird’s-eye view of the process without going into the details.
Four steps to results
In order to analyze share prices from the Internet with DeltaMaster, we will work with two of its components: TableWizard and CubeWizard (see DeltaMaster clicks! 04/2010). Both tools are integrated in DeltaMaster but will only be displayed if you have a valid license. To test this functionality, therefore, you do not need an additional installation – just an additional license which we can gladly provide upon request.
Here are the four steps:
- Gather data and save it as a table in Microsoft Excel
- Open the Excel spreadsheet with DeltaMaster TableWizard and create an analysis model
- Save the analysis model as an OLAP database with DeltaMaster CubeWizard
- Open the OLAP database with DeltaMaster and generate reports
Depending on which analyses you need, you might even be able to skip step 3. See below for more information.
Gathering data and saving it as a table
As previously mentioned, isolated data can have various origins. Some data you may already have, while other information you have to gather on your own. You can collect share prices from many different Internet services, which sometimes even offer functions to export this data to a file.
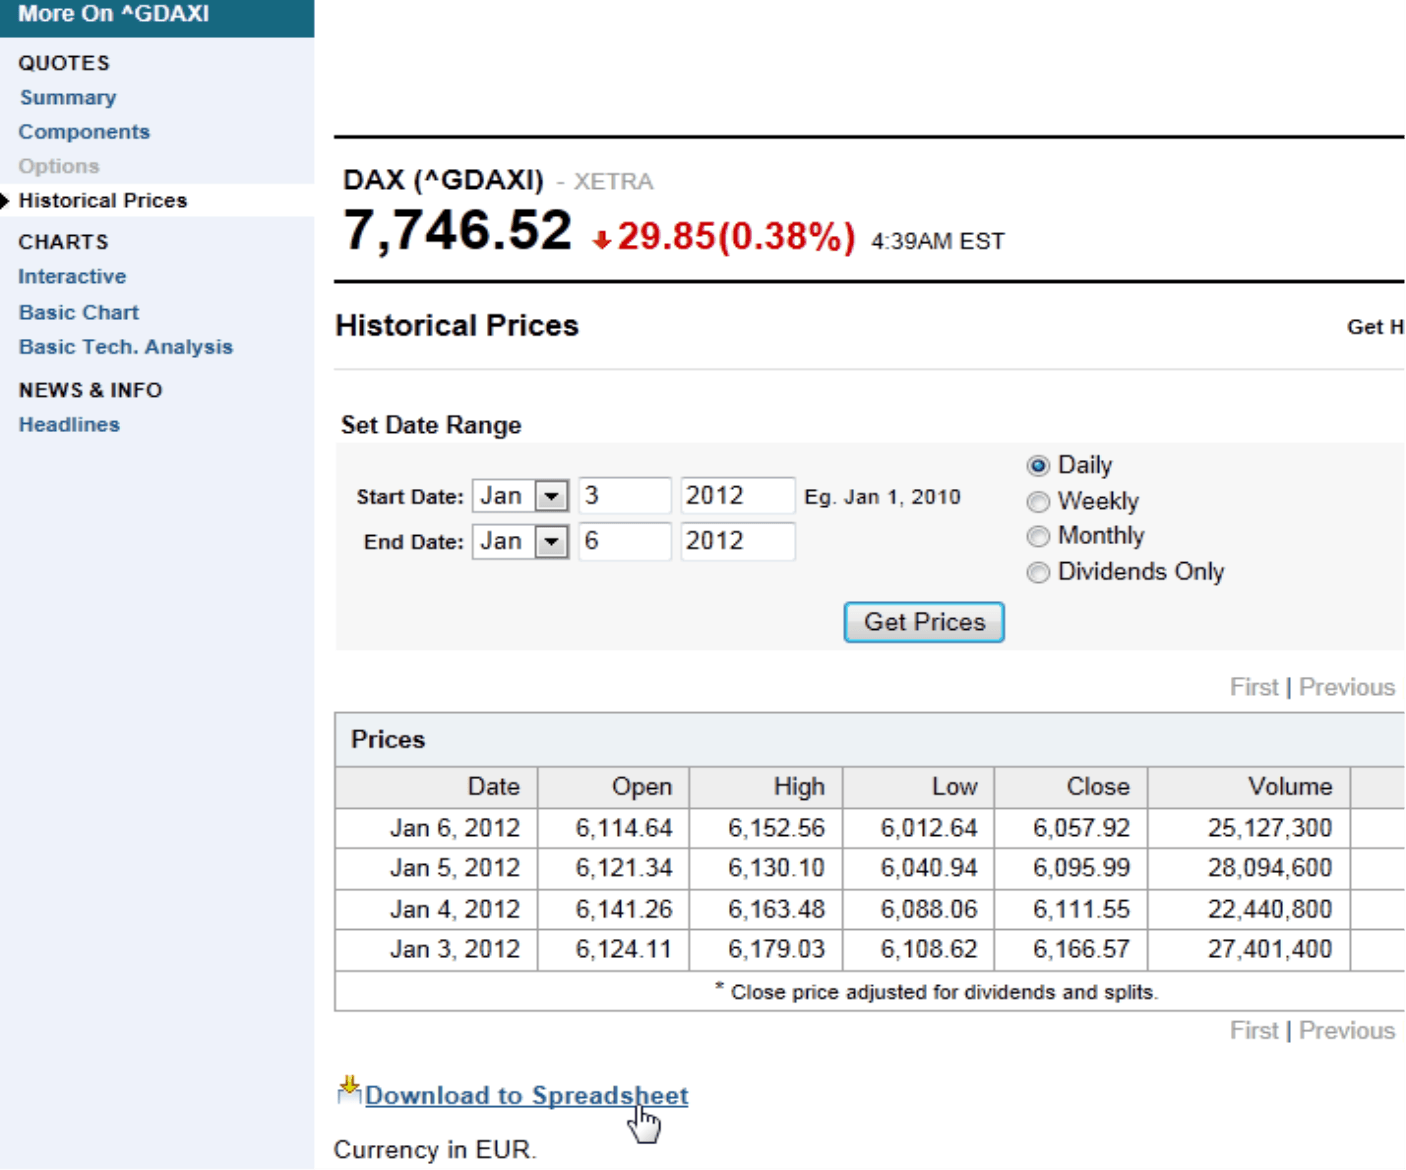
With Yahoo!, you can query historical prices for different indexes with a customized start and end date. You can also opt to download this data to a spreadsheet, which in this case is a CSV file (i.e. comma-separated values in a text file). The screenshot on your right shows that Yahoo! uses the symbol “^GDAXI” for the DAX. To get even faster results, you can use inexpensive programs such as “YLoader”, which queries the share prices for many shares at once and saves them to file. When you download the share prices, please check that the number format corresponds with the standard formatting in your application (e.g. periods for decimals in the U.S., commas in Germany). In order to use this data with DeltaMaster TableWizard, you first need to save it as an Excel file. The first row (and this one only) should contain column headers such as “Share”, “Date”, “Open”, or “Close”. You can also add additional data fields (i.e. columns) to the Excel file, for example, so that you can generate the calendar week, the month, or the quarter based on the date.
If you don’t want to download the data yourself, but still want to work through the following steps, we can gladly provide you with the same data (with no further obligation from our side) that we used in this edition of clicks!. Simply send us an e-mail.
DeltaMaster TableWizard: Generating an analysis model
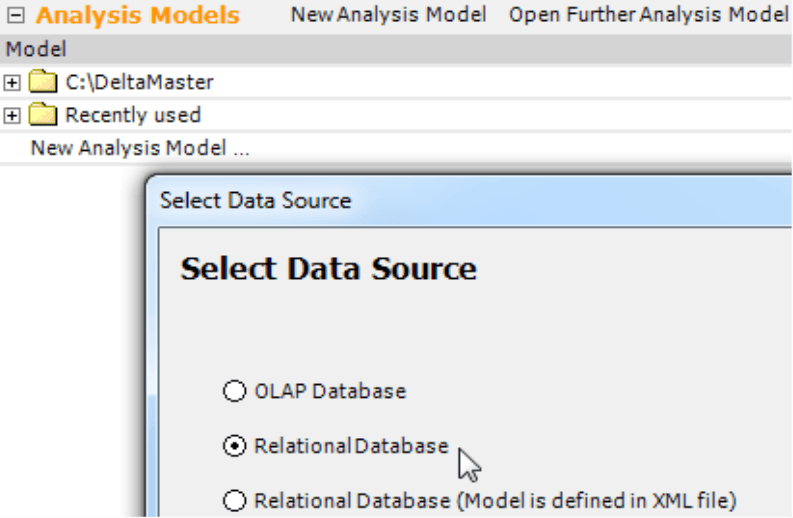
You need the Excel spreadsheet only to make use of its file format. The calculations, analyses, and presentation, however, will all be done in DeltaMaster. As a result, you must first create a New analysis model in Miner mode (File menu or on the Portal page). When you are prompted to Select [the] data source, click on Relational database. If DeltaMaster does not display the dialog box on your right, you might not have a valid license for TableWizard. In this case, please contact us to receive a test version.
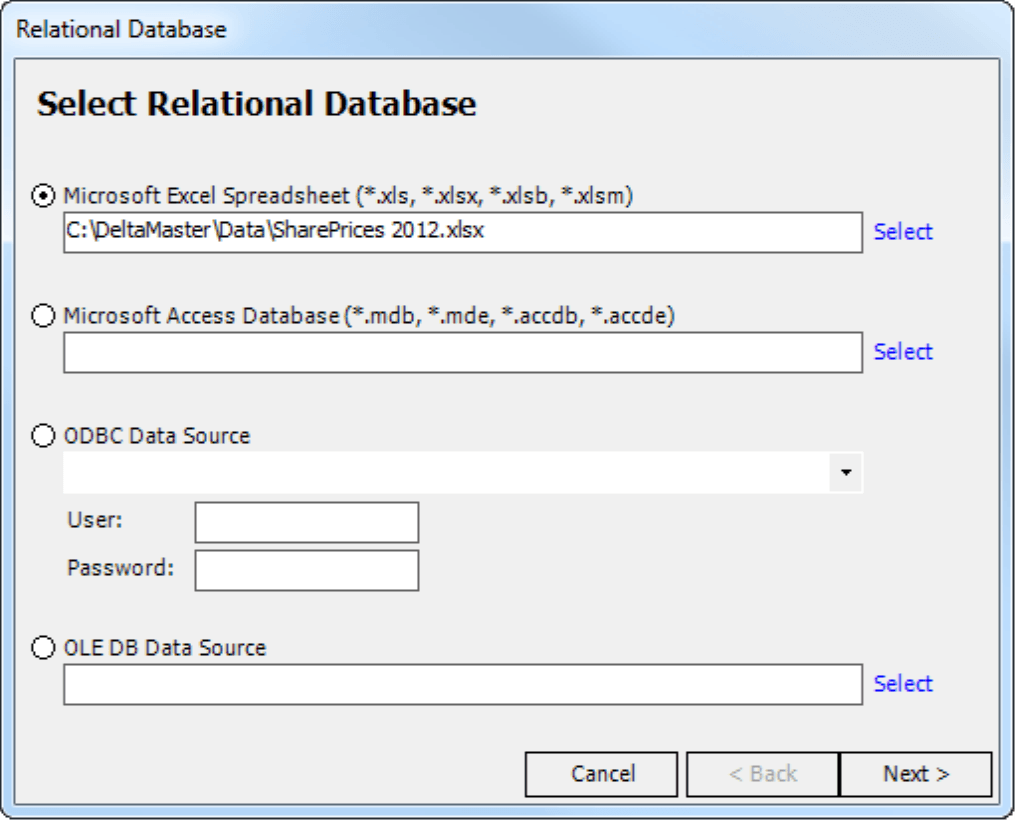
Next, you will need to Select [the] relational database, in this case, the Excel file containing the share prices.
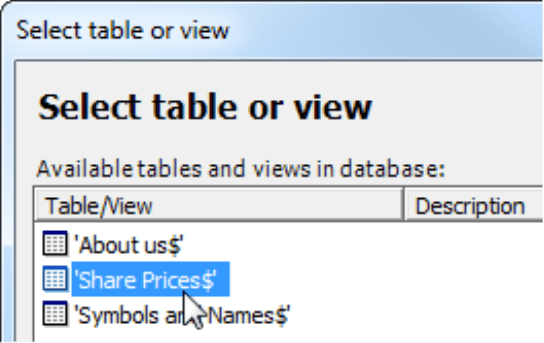
DeltaMaster will open the respective file and allow you Select [the] table or view that you wish to use – in this case, the worksheet containing the share prices.
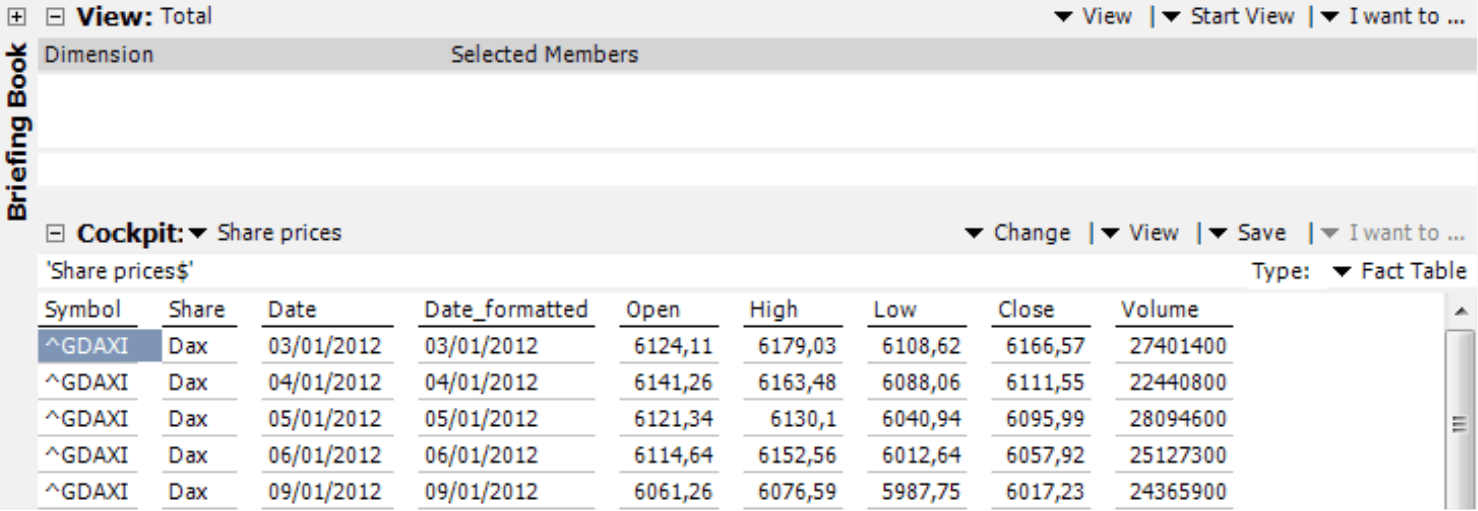
DeltaMaster then reads the table and displays it in the Cockpit window. At a first glance, it may look like a pivot table. It is, however, a fact table. Fact tables contain functions which you can use to design your data model – not to analyze it. If you look in the View window, for example, you will see that it is empty because there are no dimensions at present.
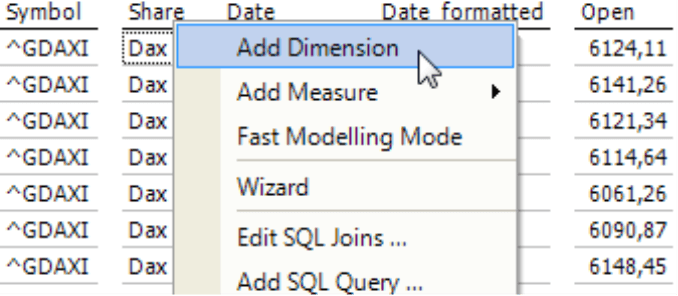
By opening the context menu of the column header, you can Add [a] dimension for the attributes in the columns. This makes sense for the columns “Share” and “Date”.
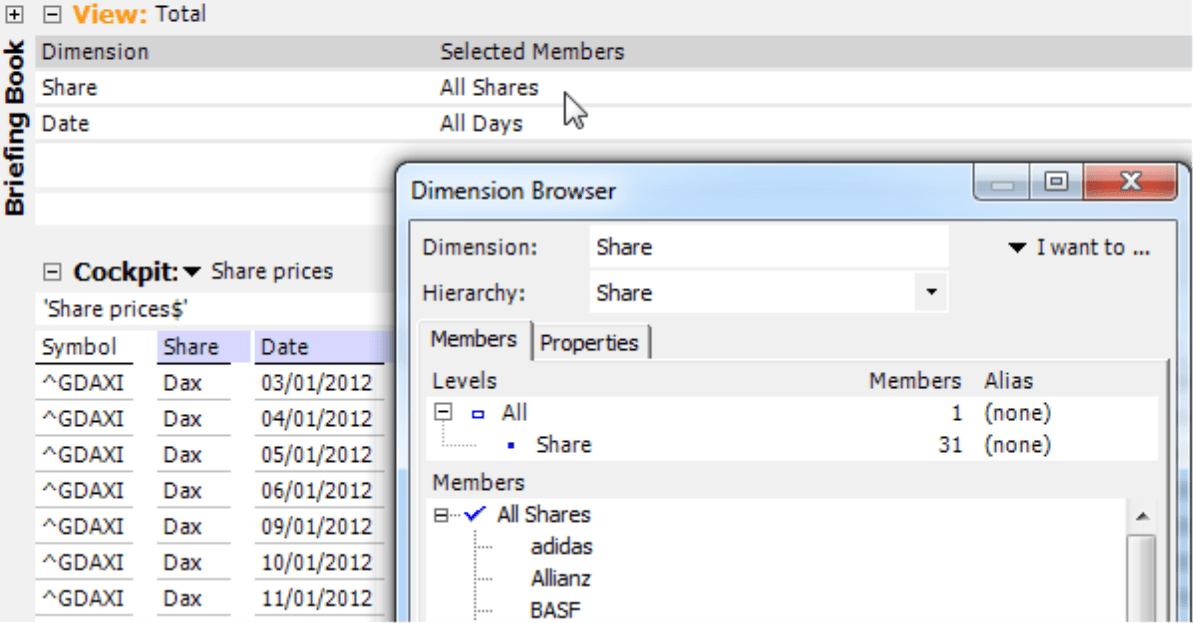
You can use this function to create two dimensions, which you can immediately view in the Dimension browser.
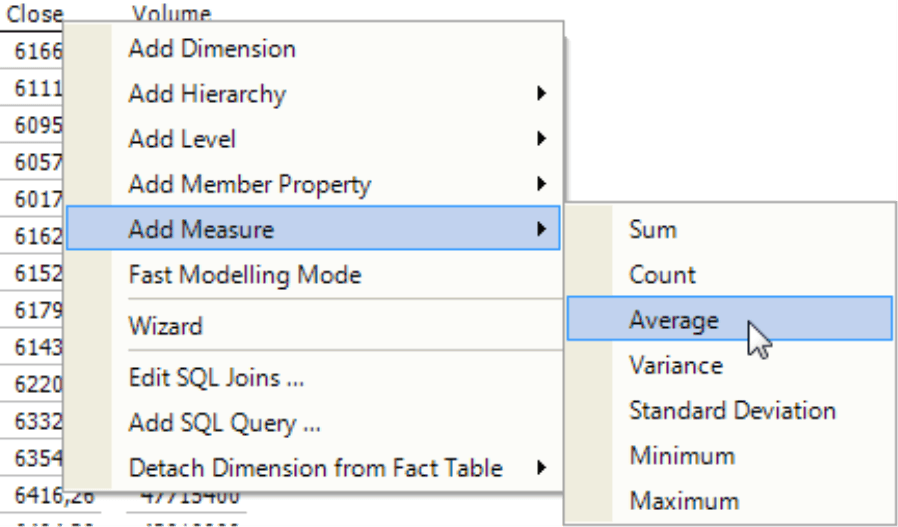
What you now need is measures, in particular, the closing price. Once again, you can Add [a] measure by opening the context menu of the column header. In the submenu, you can select which aggregate function you want to apply to the values. Share prices and other prices are aggregated by their Average. If you want to summarize the prices of an entire week, for example, you would list the average price – not the sum of them.
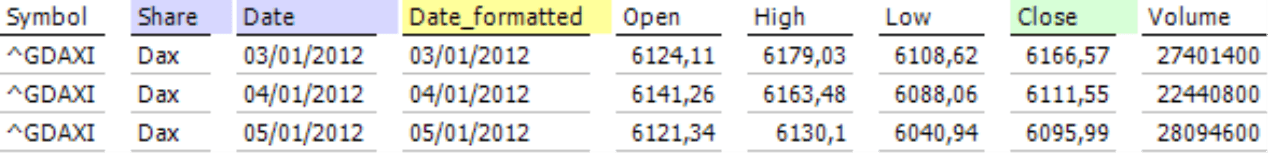
You can directly view your modeling progress based on the color coding in the fact table: Dimensions, hierarchies, and levels are marked in blue, member properties are yellow (we added a formatted date in the table shown above), and measures are green.
For some analytic tasks, this may already be enough. You can use this fact table to create pivot tables, filter measures, visualize them with graphic elements, calculate rankings, generate time series charts, and more. If you save these modifications as an analysis session (DAS file), it will contain more than just information for providing (relational) access to the data in the Excel sheet (or, alternatively, an Access database). It will also include definitions of cockpits, analyses, and reports as well as their dimensions and measures.
Other types of comparisons, however, require OLAP capabilities, particularly calculated members (e.g. budget-actual variances), time analysis members (e.g. variances to the previous period or previous year), and named sets (e.g. the top ten customers). These constructs are not supported in purely relational models but are often helpful for flexible data analysis. As a result, we generally recommend transferring the data into an OLAP database after you have created the relational model. That may sound complicated, but all it takes is a few mouse clicks.
DeltaMaster CubeWizard: Saving an analysis model as an OLAP database
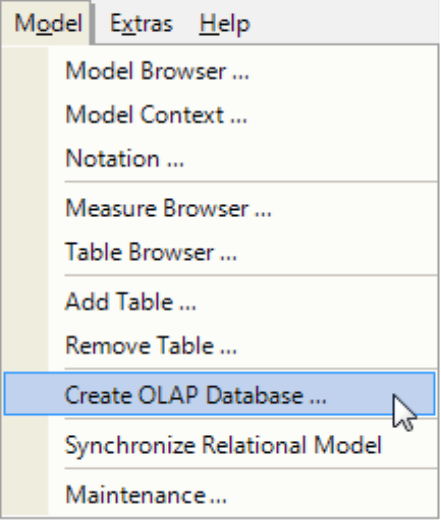
With DeltaMaster CubeWizard, you can Create [an] OLAP database directly from the current analysis model (Model menu).
Now you select which Type of database you want to generate: a local Cube file or a Server database. For smaller datasets and occasional analyses, Cube files are more practical because you can use them without the need for a database server and are easy to “transport” because all of the information is written to a single file (.CUB extension). On the downside, multiple users cannot access Cube files simultaneously – but given the scenarios above, that is no major drawback. We recommend that you create Cube files in Microsoft Analysis Services 2005/2008/2012 format (i.e. not in Analysis Services 2000).
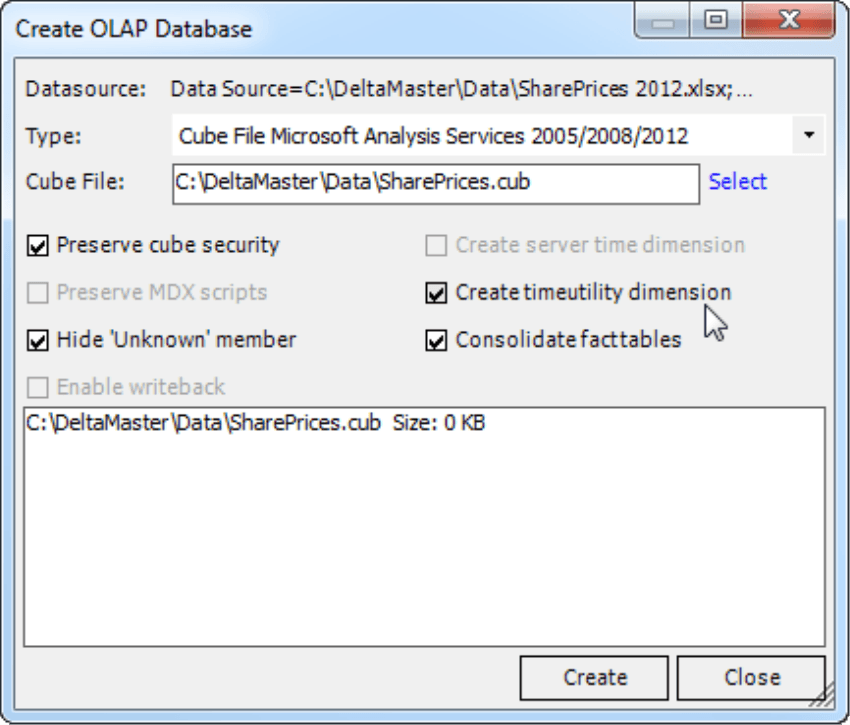
If desired, CubeWizard can Create time utility dimensions for you. In DeltaMaster, “Time utility” dimensions contain time analysis members, in other words, members that calculate variances, deliver values for the previous period (or year) based on the current period, or make other time comparisons. For more information on time analysis members, please read DeltaMaster clicks! 08/2007.
In most cases, you will also want to activate the Hide unknown members option. If you do not, CubeWizard will generate a member called “Unknown” on every dimension level. “Unknown” members contain otherwise unassignable values and, therefore, are not always necessary. In our example, for instance, all of the share prices are assigned to a known stock – therefore, having a separate “collection area” for unassigned values is pointless. For scenarios such as these, CubeWizard can Hide unknown members from the start.
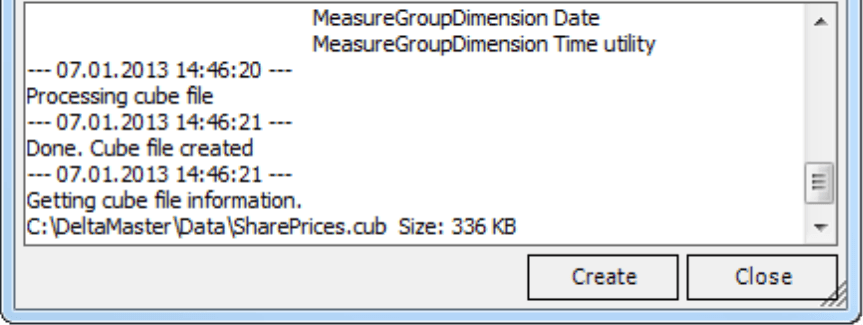
If you click on Create, CubeWizard will generate the OLAP database and output status information during processing. The “Done. Cube file created” message indicates that the data is now available in a multidimensional OLAP database file, and you can work with and analyze this information using the full functionality of DeltaMaster.
In order to use CubeWizard, you must install the “Microsoft Analysis Services OLE DB Provider” driver, which you can obtain free of charge from Microsoft. In most cases, this driver has already been installed with other programs. Simply try it to find out.
DeltaMaster: Creating reports
In order to access the local cube file that you have just saved, you now need to create a second analysis model (File menu or Portal page) – this time for an OLAP database.
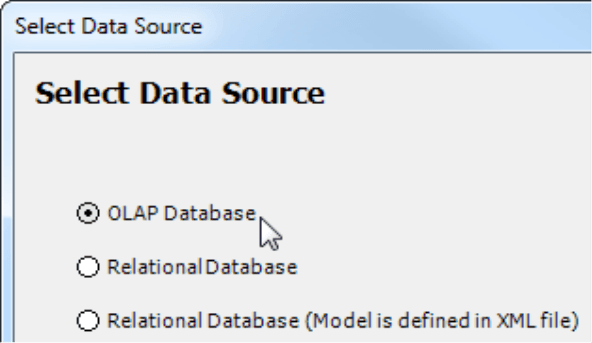
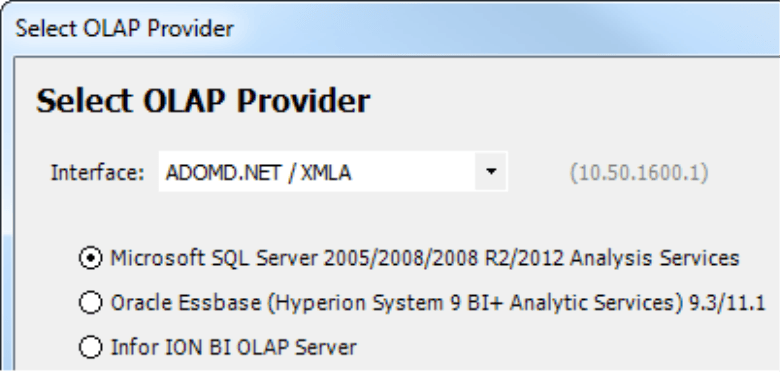
The following dialog boxes are probably familiar to you. You must Select [the] OLAP provider, which is Microsoft SQL Server Analysis Services for our local cube file. When you Login to [the] OLAP database afterwards, simply select the Cube file that you have just generated. This file only contains one cube, which you should select in the next dialog box. Afterwards, you can Connect to [the] relational model to access the original data in the Excel file. (In our example, this is not necessary. Plus, you can always configure the connection at a later time.)
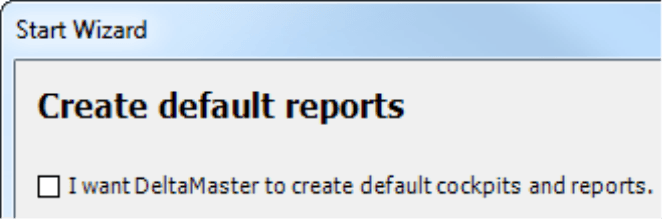
The Start wizard will also ask if you want it to Create default reports. These reports are intended for more complex presentations similar to those used in monthly or quarterly financial reporting. Since you do not need them for this simple example, please uncheck this option.
Now you will find yourself in a new analysis session where you can access all of DeltaMaster’s familiar tools. Before you start an analysis, however, you may want to tidy up some things first. For example, you could change the name of the automatically generated counter (Model menu, Measure browser), or simply call the closing price “Price”. You may also want to display this measure formatted as a Number with 2 decimal spaces (Properties in the measure’s context menu in the Measure browser or F4 key). You should also designate the “Date” dimension as a time dimension (context menu of the dimension in the View window, Dimension type, Time). To change the name of the standard member “Current” in the period view dimension, for example, you simply open the context menu of the member in the Dimension browser and select Edit member).
With a bit of experience, you should be able to work through these steps in just a few minutes. Now you can reap the rewards of your preparation – and leverage the automated analytic methods and modern visualization forms DeltaMaster is famous for.
Here are some examples:
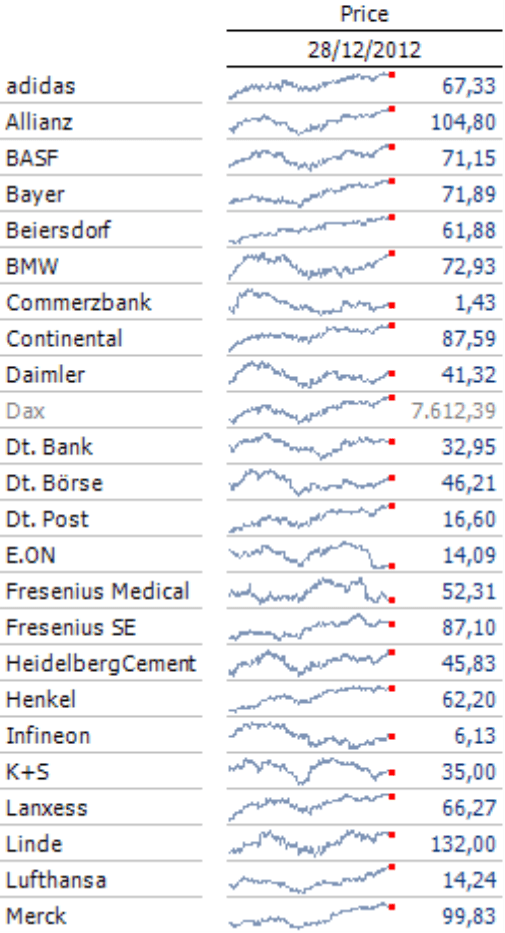
Sparklines are almost destined for creating optical comparisons of stock histories. In order to make differences in percentages comparable, you will need to apply a logarithmic scale between minimum and maximum as shown in the screenshot on your right.
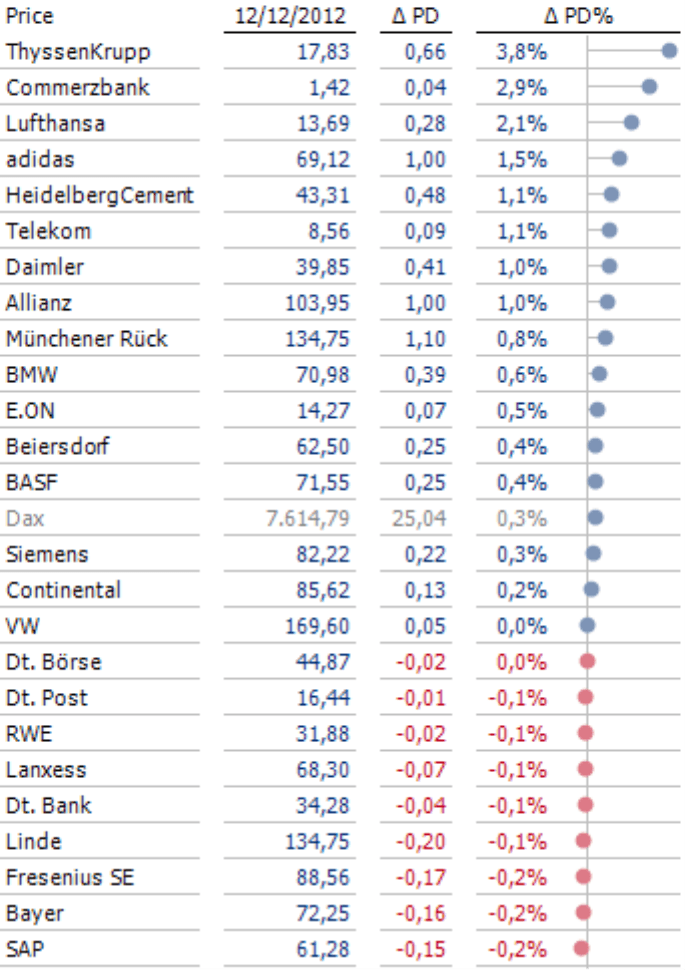
The screenshot on your right shows the closing price for a set date as well as the absolute and relative changes compared to the previous day – similar to what you would see in the stock market section of a daily newspaper. This presentation, however, also sorts the changes so that you can quickly identify the winners and losers of the day – something you don’t see (but from an analytical standpoint would make sense to show) in the papers. It also contains the DAX itself as well so that you can quickly see which shares performed better (or worse) than the index as a whole. For this screenshot, we also defined changes as a time analysis member and set the style of the graphical elements and text color for the DAX as notation rules (see DeltaMaster clicks! 08/2009).
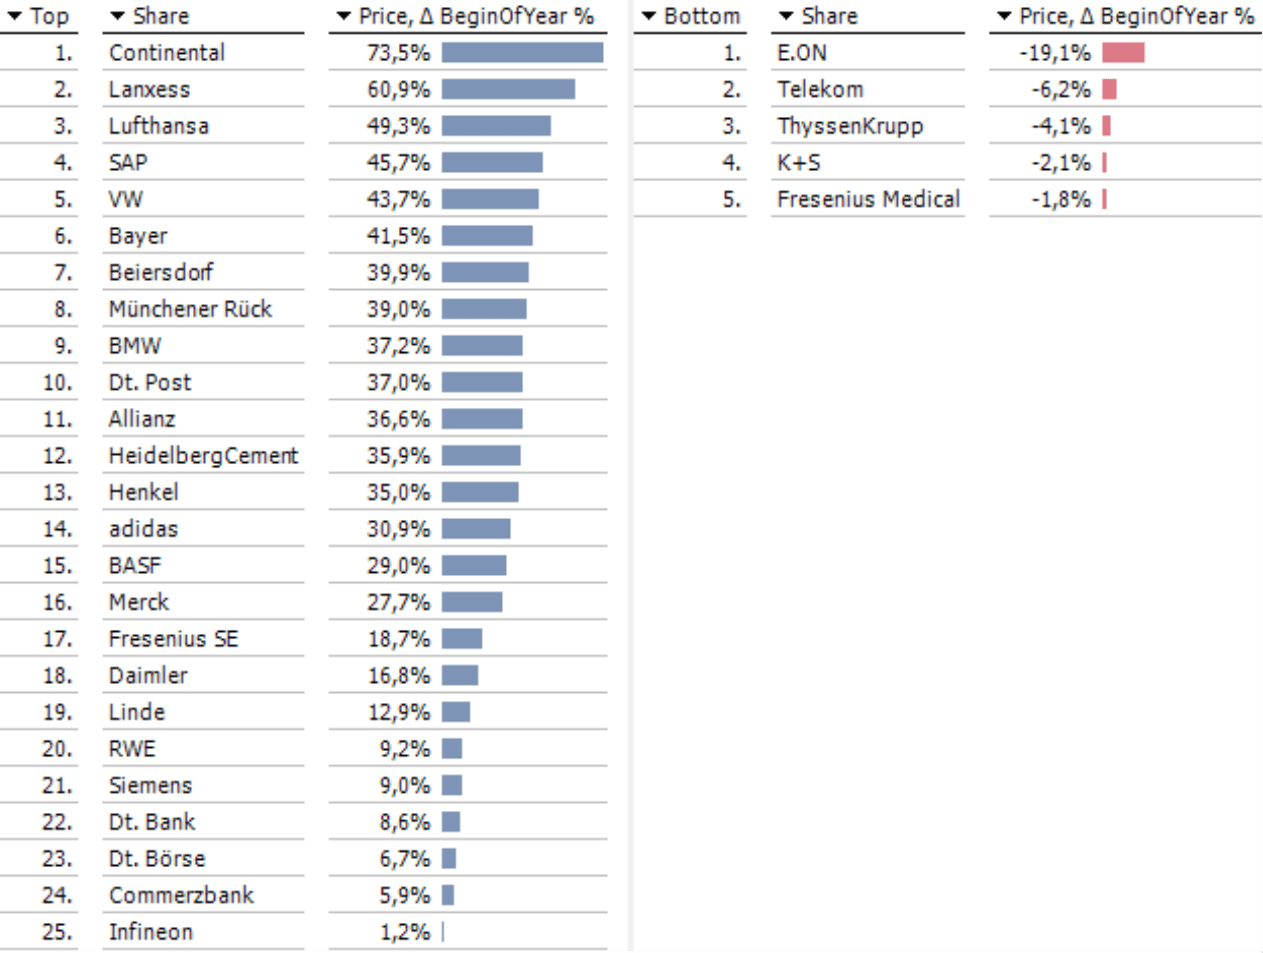
When it comes to declaring winners and losers, you often want to observe developments over a longer period of time, for example, an entire year. There are many different ways to create these types of analyses. One solution is to create three new measures: the first as a Filter value (Model menu, Measure browser) that will fix the price at the beginning of the year, a second User-defined measure that calculates the difference of the current price to the start price, and the third as a Quotient value that divides the difference by the start price to calculate the percentage change. The Ranking will generate a split list that clearly lines up the winners opposed to the losers.
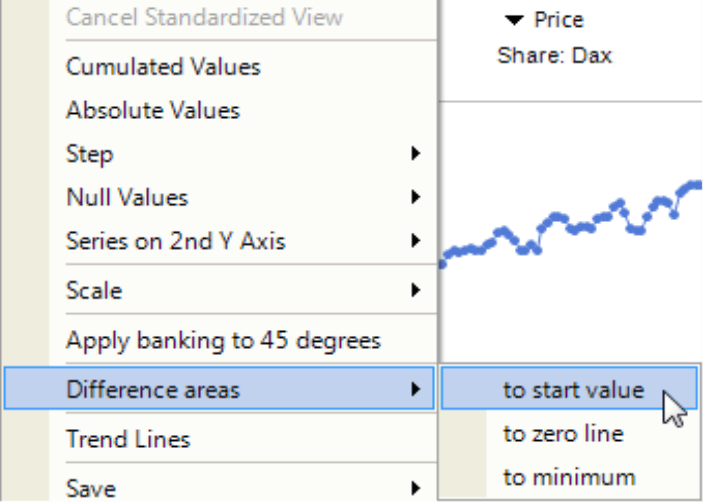
To make the Small Multiples report that you saw at the very beginning, start a Time series analysis for the measure “Price” and choose any share. In order to color the changes to [the] start value, simply activate the respective Difference area in the context menu.
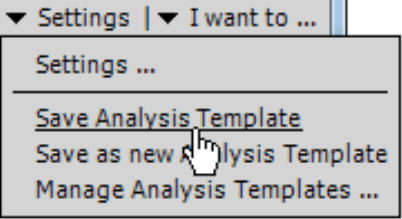
Once you have configured the settings for the time series chart, you can save it as an Analysis template (Settings menu).
You can now reuse this template to make a Small Multiples report (see DeltaMaster clicks! 12/2008). This analytical method, which iterates (i.e. calculates) the template over various shares, automatically combines and formats the individual charts into a single report.
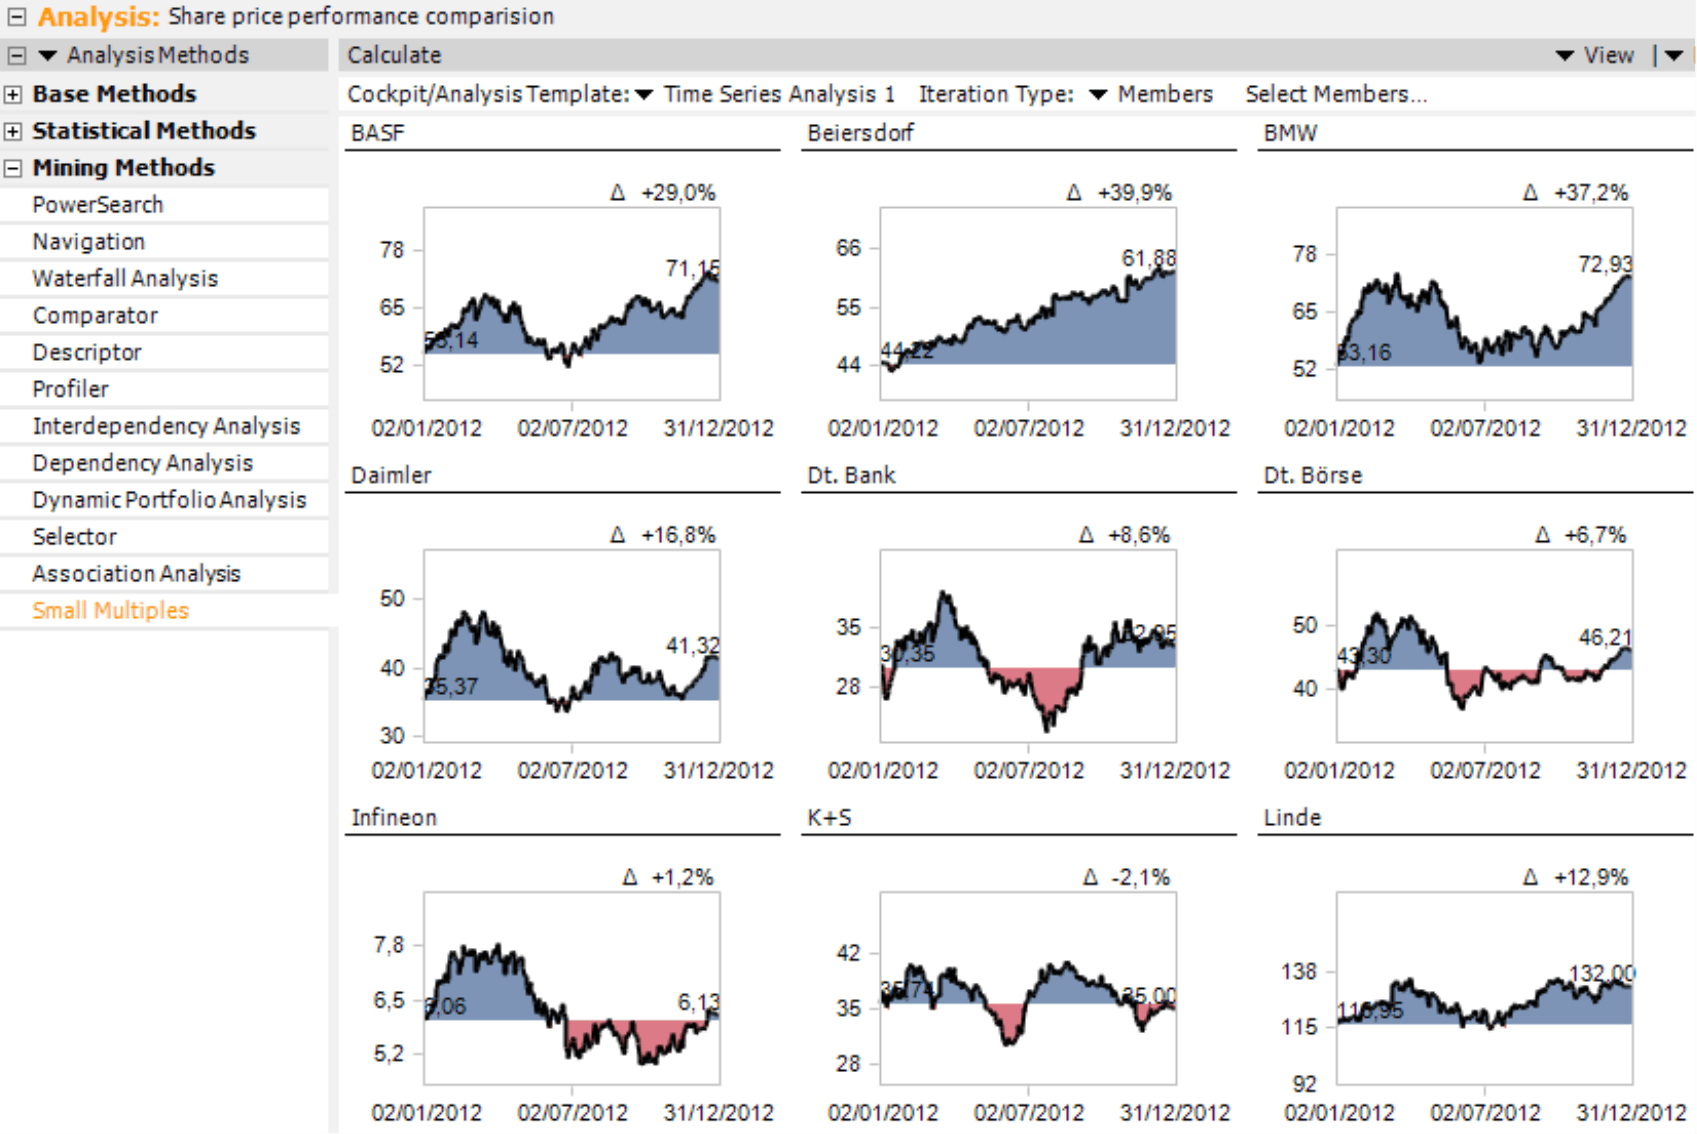
Different-sized areas help readers understand when variances have occurred and on what scale. Although the human eye can’t estimate and compare areas very well, it is capable of seeing if there is a lot (or a little) of blue as well as a little (or a lot) of red.
Try it yourself
In this edition of clicks!, we wanted to show that DeltaMaster is your analytic tool of choice – for minor ad hoc inquiries as well as major Business Intelligence. With the help of TableWizard, you can also analyze Excel tables and Access databases with DeltaMaster. If you take a small extra step, you can also transform the data into an OLAP database with CubeWizard to leverage the full functionality of DeltaMaster. You’ll quickly see that the few mouse clicks that it takes to create the database are well worth your time and effort.
Questions? Comments?
Just contact your Bissantz team for more information.
