![]()
Greetings, fellow data analysts!
To be an informative speaker or writer, you should use concrete words – and, ironically, that’s often easier when you think abstractly. Abstraction doesn’t mean omitting things that aren’t important, but rather finding things in common. In reporting, for example, you rarely deal with just any old customers, product groups, or business divisions. You select them using set criteria based on a rule – customers with the highest revenues, product groups with the largest inventory, or business divisions with the greatest variances.
If you define these types of rules in DeltaMaster and build a report based on them, you can easily update the report or evaluate it in another context. You can also generate very intensive visualizations if you dynamically group many similar report components – with Small Multiples. For some more concrete tips, just read this informative edition of DeltaMaster clicks!.
Best regards,
Your Bissantz & Company team
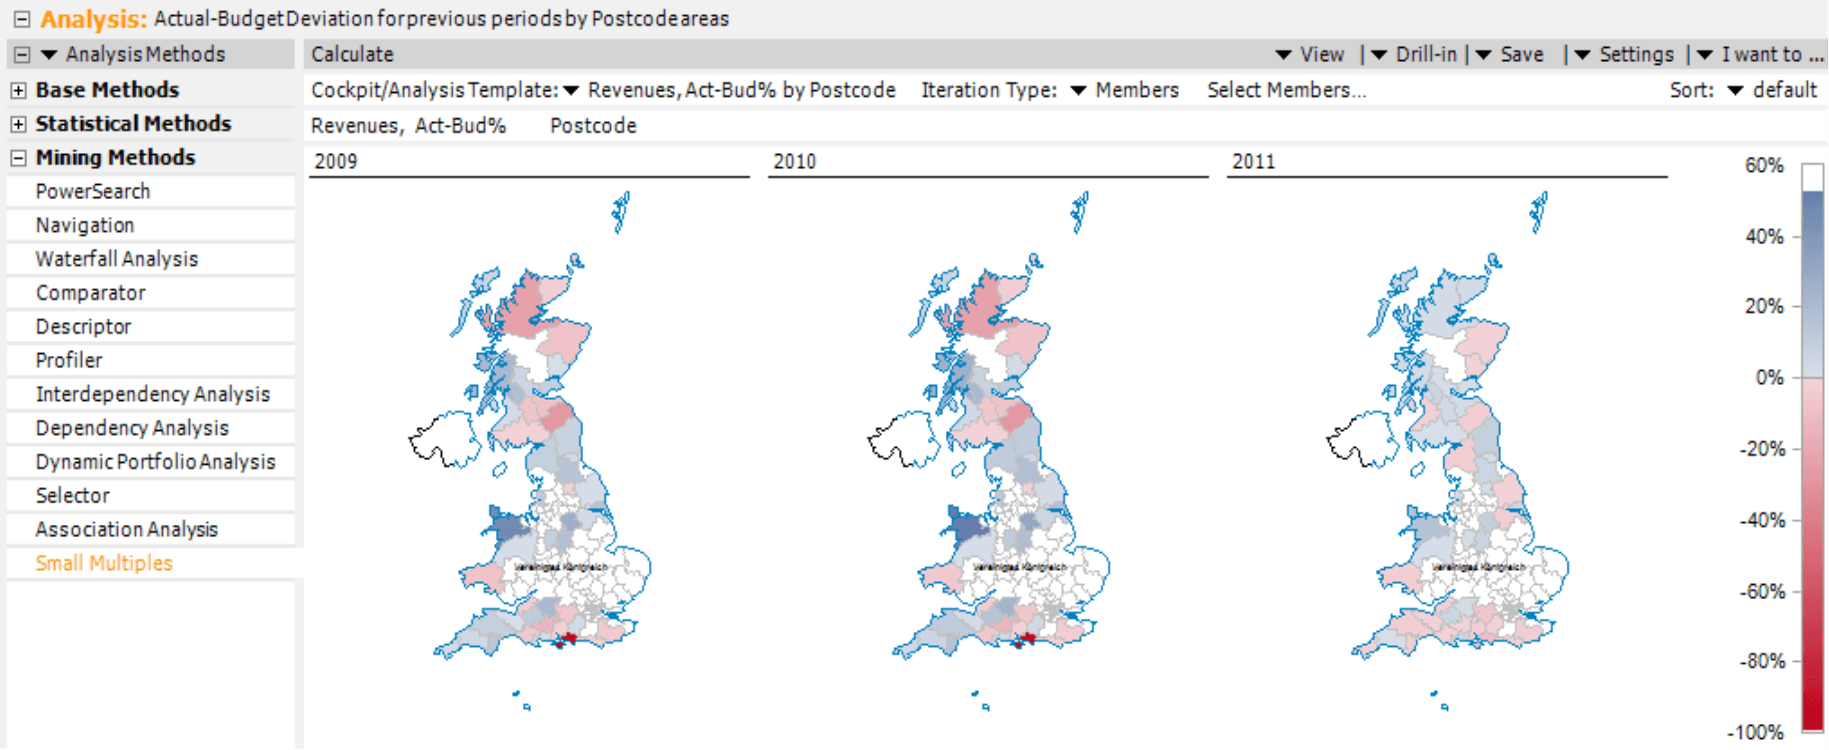
You probably already know about the concept of Small Multiples from past editions of clicks!. Small Multiples apply the same basic design to multiple report objects. In other words, the content changes while the form stays constant. For example, instead of showing one profit/loss statement, they display several – one after another with the same structure but for different companies in one report. Rather than one sales statistic, you see multiple ones with the same structure but for different business divisions in one report. In place of one map, you see several from the same country but for different years in one report – just as in the screenshot below.
This concept allows you to produce highly informative reports, which you can use to make many different comparisons. What’s more, these reports are easy to read and understand because they reuse the same principle for making comparisons. As soon as your readers have understood one multiple, they can understand the others and even view them in relation to each other. As a report editor, you profit from Small Multiples reports as well because you can recycle them over and over again. The report is based on components that you can also use separately in an analysis session. The Small Multiples method brings them together with just a few settings and takes care of the labeling, formatting, and scaling for you.
We have already talked about Small Multiples in DeltaMaster clicks! 12/2008 and 11/2010. In this edition, however, we want to highlight a specific detail – namely, how you can dynamically define the objects that you want to iterate using a specific template. In this context, we want to illustrate these two useful effects:
- One parameter automatically triggers further ones – The user, therefore, only has to make one selection and further ones automatically follow.
- Analytics determine which objects should be displayed – Instead of explicitly enumerating objects, DeltaMaster should first apply analytic criteria to determine which ones it should include before calculating the report.
In order to dynamically design Small Multiples reports in this fashion, we will use two tried-and-true components that you can use in all DeltaMaster applications: time analysis members (or, more generally, calculated members) and named sets.
Let’s recap…
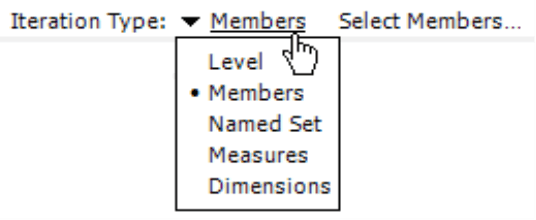
As you already know, a Small Multiples report is based on a cockpit or analysis template that is calculated multiple times – each time for a different object. As a result, you get a separate multiple for each object. These reports differ in what they display – not how they report it. You can apply this repetition – or “iteration” as we call it – over Levels, Members, Named Sets, Measures, and Dimensions. We call these five options Iteration types. The first three are similar because they all iterate dimension members – either all members on a Level (e.g. all members on the “Region” level), select Members (e.g. just “North” and “West”), or members that comprise a Named set.
Small Multiples with time analysis members
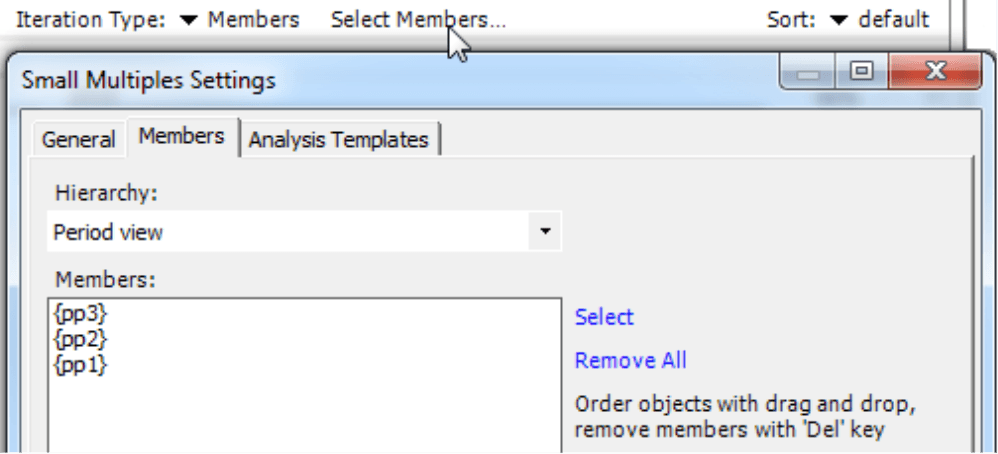
Let’s start with a simple example using the report containing the three maps from the previous page. This report iterates select Members, namely, three members from the “Period view”. This time utility dimension, which may have a different name in your data model, contains the Time analysis members which DeltaMaster uses for making comparisons with the current period.
A time analysis member, for example, could deliver the value of a measure from the previous period, the variance to this value, a year-to-date cumulation, a rolling average of the past six months, and more. DeltaMaster clicks! 08/2007 explains this concept in detail. In this example – geo analyses for the past three periods – you need members that have Query as their Calculation type so that you can access values from a previous period. This “simple” previous period (with a gap of 1, “{pp1}”) already exists in most models. If you wish, you can also create additional time analysis members for other past periods.
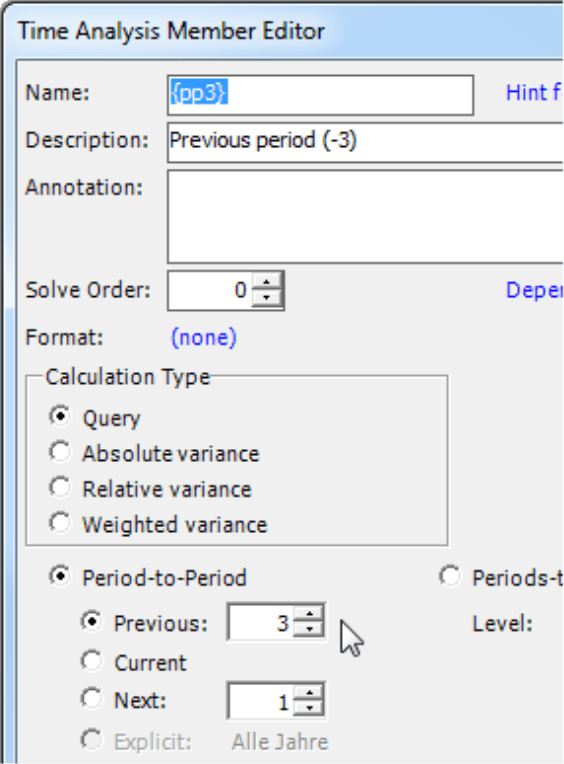
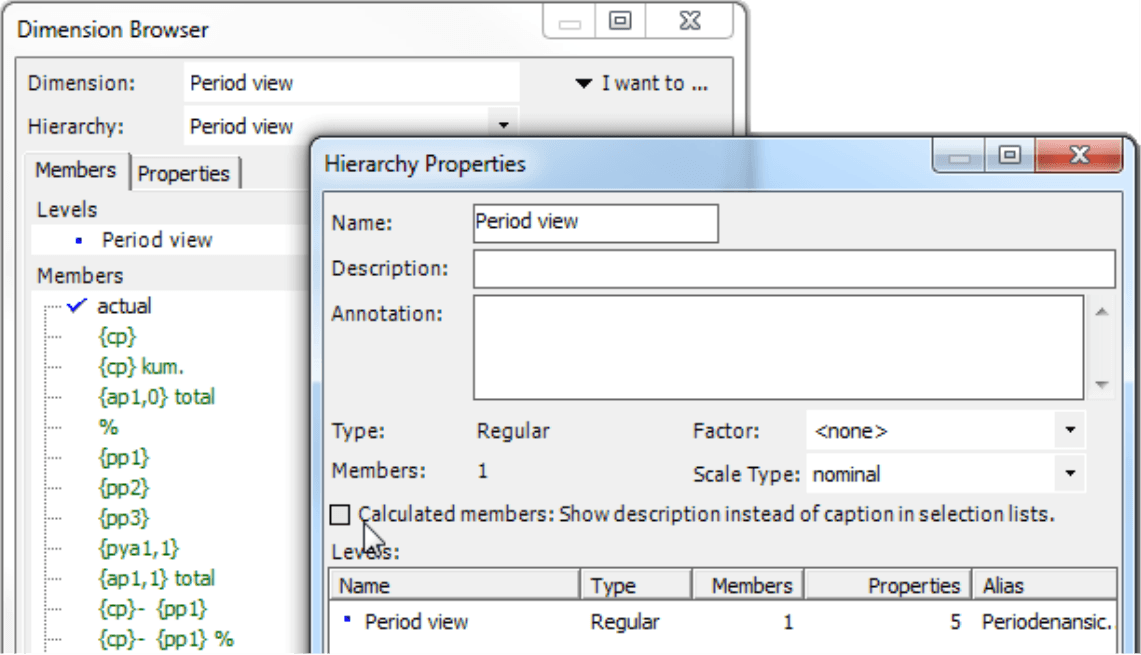
As you can see in the screenshot on your right, DeltaMaster gives the time analysis member a variable for its name. When displaying a report, however, DeltaMaster will use the actual name of the period. “{pp1}” stands for “previous period” with a gap of 1. For 2012, that would be 2011. For November 2012, that would be October 2012. “{pp2}” represents an earlier period with a gap of 2. For 2012, that would be 2010. For November 2012, that would be September 2012.
You can read more about these variables in DeltaMaster clicks! 08/2007. Variables ensure that DeltaMaster automatically shows the correct time period in reports, cockpits, and analyses. These short names, however, are not easy to read and use if you decide to display them (e.g. in the Dimension browser) instead of replacing them. As a result, you will probably want to give the time analysis member an accurate description and change the settings of the Hierarchy properties (I want to… in the Dimension browser) so that DeltaMaster will Display the description instead of the name in selection lists.
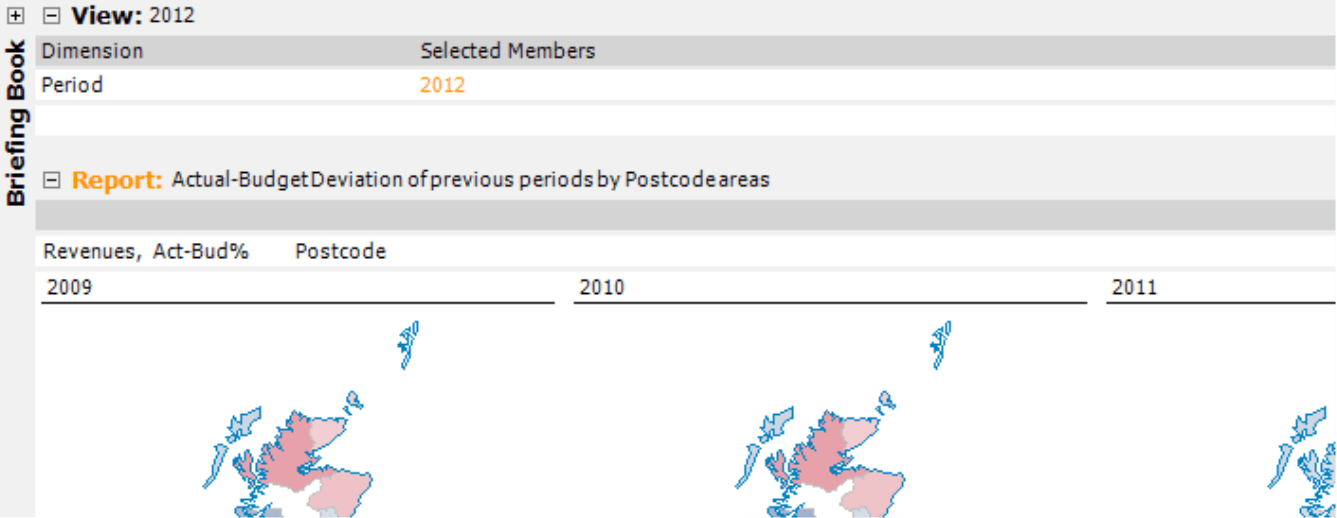
In Viewer mode, you can easily see how this report changes when you select different time periods from the View window.
If you select the year 2012, for example, the multiples will display the years 2009, 2010, and 2011.
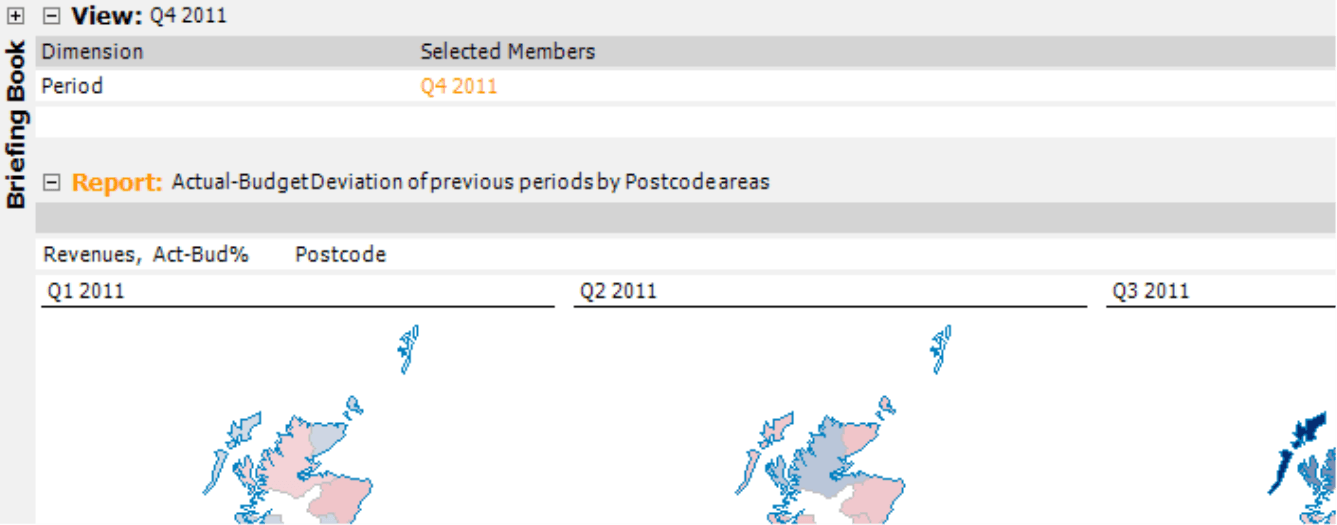
If the user selects a quarter, the report will display the three preceding ones.
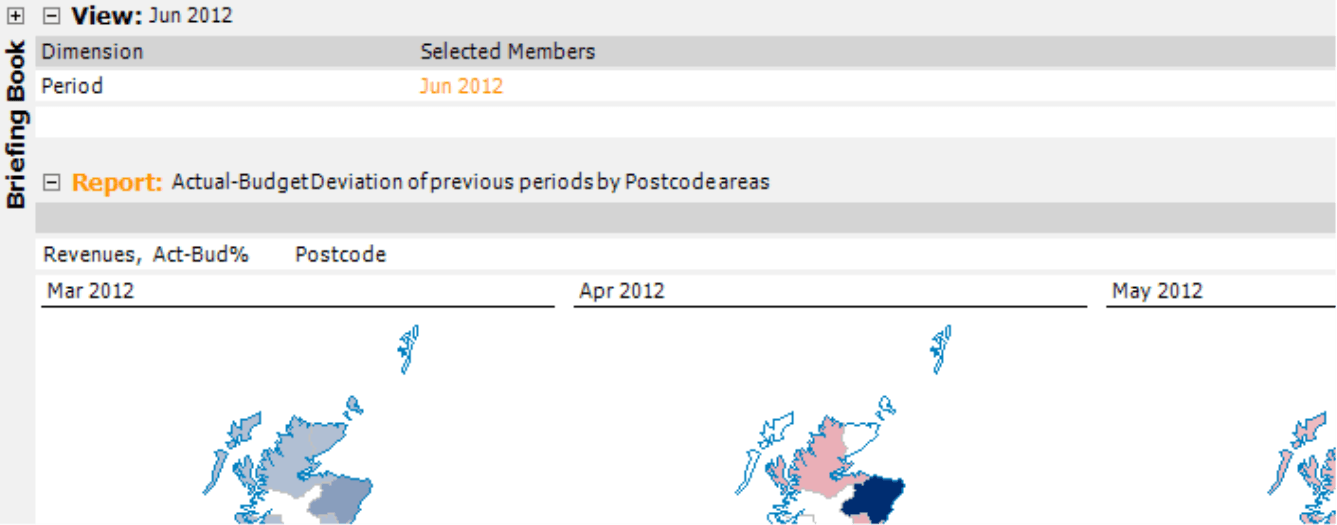
This same principle also works with months. If you select one month, DeltaMaster will display the three previous ones.
Small Multiples with dynamically defined named sets based on the view
In the previous example, the time analysis members were dynamic – a good solution if you want to calculate the same type of multiples for just a few periods and place them next to each other in a Small Multiples report. This approach can quickly reach its limits, however, if you need to display periods over a longer time frame – such as the 13 months from the current period to the same one last year. First of all, you would have to create 13 time analysis members and then select them, which gets a bit complicated. In addition, DeltaMaster applies the same number of periods to each level – in other words, 13 quarters or 13 years, which in most cases isn’t desired.
The number of members you include depends on the level – and that’s where named sets come into play. A named set is an MDX statement that returns a group of dimension members or measures. This expression can just be a simple list of members but can also include calculations and conditions – everything that MDX supports.
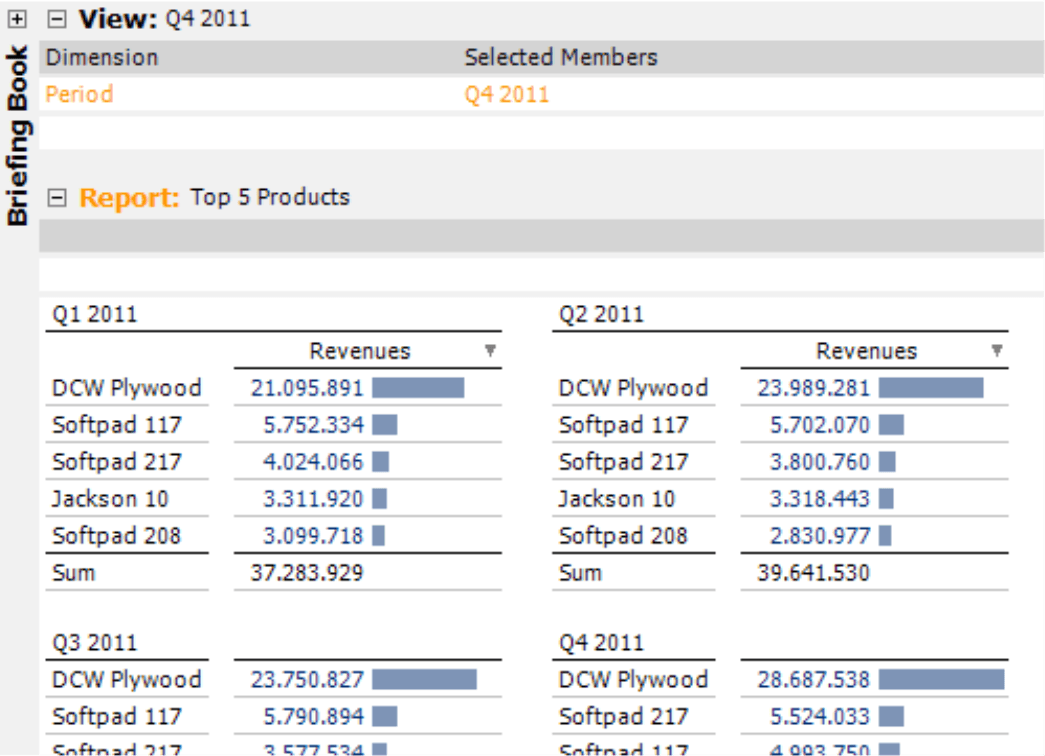
Let’s take a closer look using another example: a small pivot table with revenues on the column axis and the five top products by revenues on the row axis. In addition, you now want to view these top five products for the past six months, for the past four quarters, or the past three years. Although this task may sound simple, it is not easy to replicate this in a pivot table. After all, five different products could have the highest revenues in each of these periods and, therefore, the rows of the table would contain different members. Since all columns of a pivot table need to have the same configuration of rows, however, it would display the same five products (and not those with the strongest revenues) in all columns (i.e. periods). With Small Multiples, however, presenting this information isn’t a problem. It can calculate six, four, or three pivot tables – each with their own row order and automatically combine them into a report.
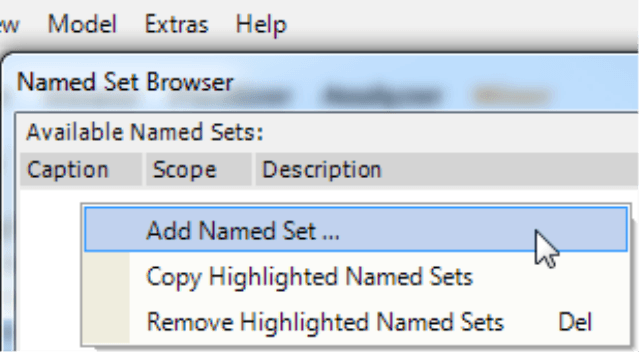
In order to dynamically select the periods, you first need to go to the Model menu and Add [a] named set in the Named set browser (context menu or I want to… menu). In the Editor for named sets, you can first select the respective Dimension and Hierarchy for the members in question. In this case, you want the time dimension which is called “Period” and only has one hierarchy.
You can implement this functionality with the following MDX statement:
LastPeriods(
Iif(<view>.Level.Ordinal = 0, 1,
Iif(<view>.Level.Ordinal = 1, 3,
Iif(<view>.Level.Ordinal = 2, 4,
6))),
<view>)
The syntax of the statement above is supported by Microsoft Analysis Services, IBM (Applix) TM1, SAP BW, and other MDX databases.
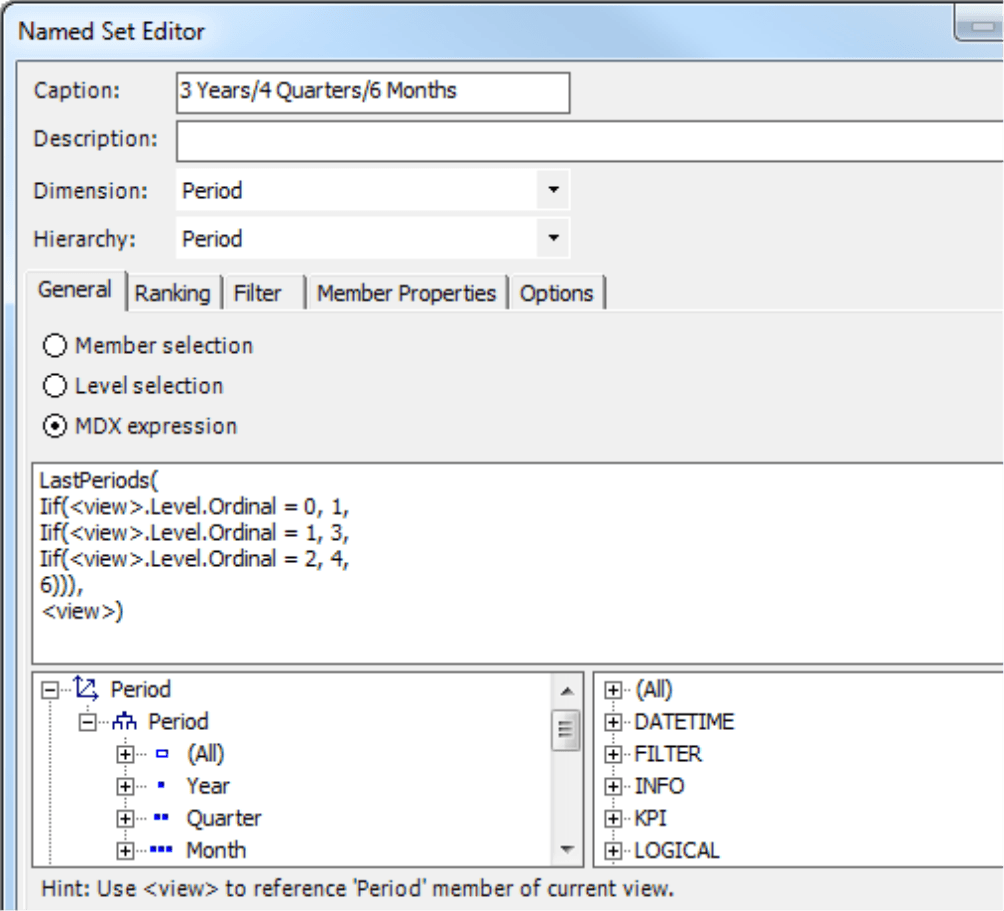
The MDX statement delivers the previous periods (“LastPeriods”) that it should count from the current period (“<view>” in the last row). In the entire expression, “<view>” is a variable for the current member in the view, in other words, for the period that is selected in the time dimension in the View window. (Please note that DeltaMaster will interpret and replace the term “<view>“; it is not part of the MDX language.) You can determine how many periods you want to include using a series of comparative expressions (i.e. “Iif“):
- If the selected member (i.e. the current one) is located in the View on the level 0 of the hierarchy (“Level.Ordinal = 0”; in our reference model: “All”), it will only include one period – the current member.
- If the current member belongs to level 1 (“Level.Ordinal = 1”; here: “Years”), it will include three members (i.e. the current year and the two previous ones).
- If the current member belongs to level 2 (“Level.Ordinal = 2”; here: “Quarters”), it will include four members (i.e. the current quarters and the three previous ones).
- Otherwise, it will include six members (i.e. six months). This logic is sufficient because the hierarchy in the example doesn’t have any more levels.
In many models, the time dimension is built the same way as it is shown above – with levels for “All”, years, quarters, and months. If this applies to your model as well, you can directly use this MDX expression in your application (different names for the levels – for example, in another language – are irrelevant). If your structure varies, please take a closer look at the numbering of the levels.
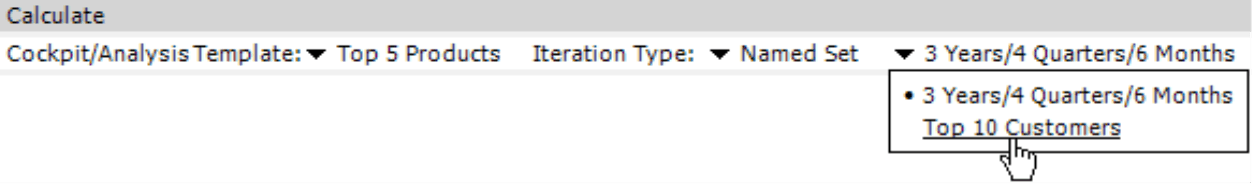
With this named set, you can now quickly define a Small Multiples report. Simply select the pivot table shown above as the Cockpit/Analysis template, Named set for the Iteration type, and the named set that was just described. From Viewer mode, you can see how the same report varies when you change the current period.
![]()
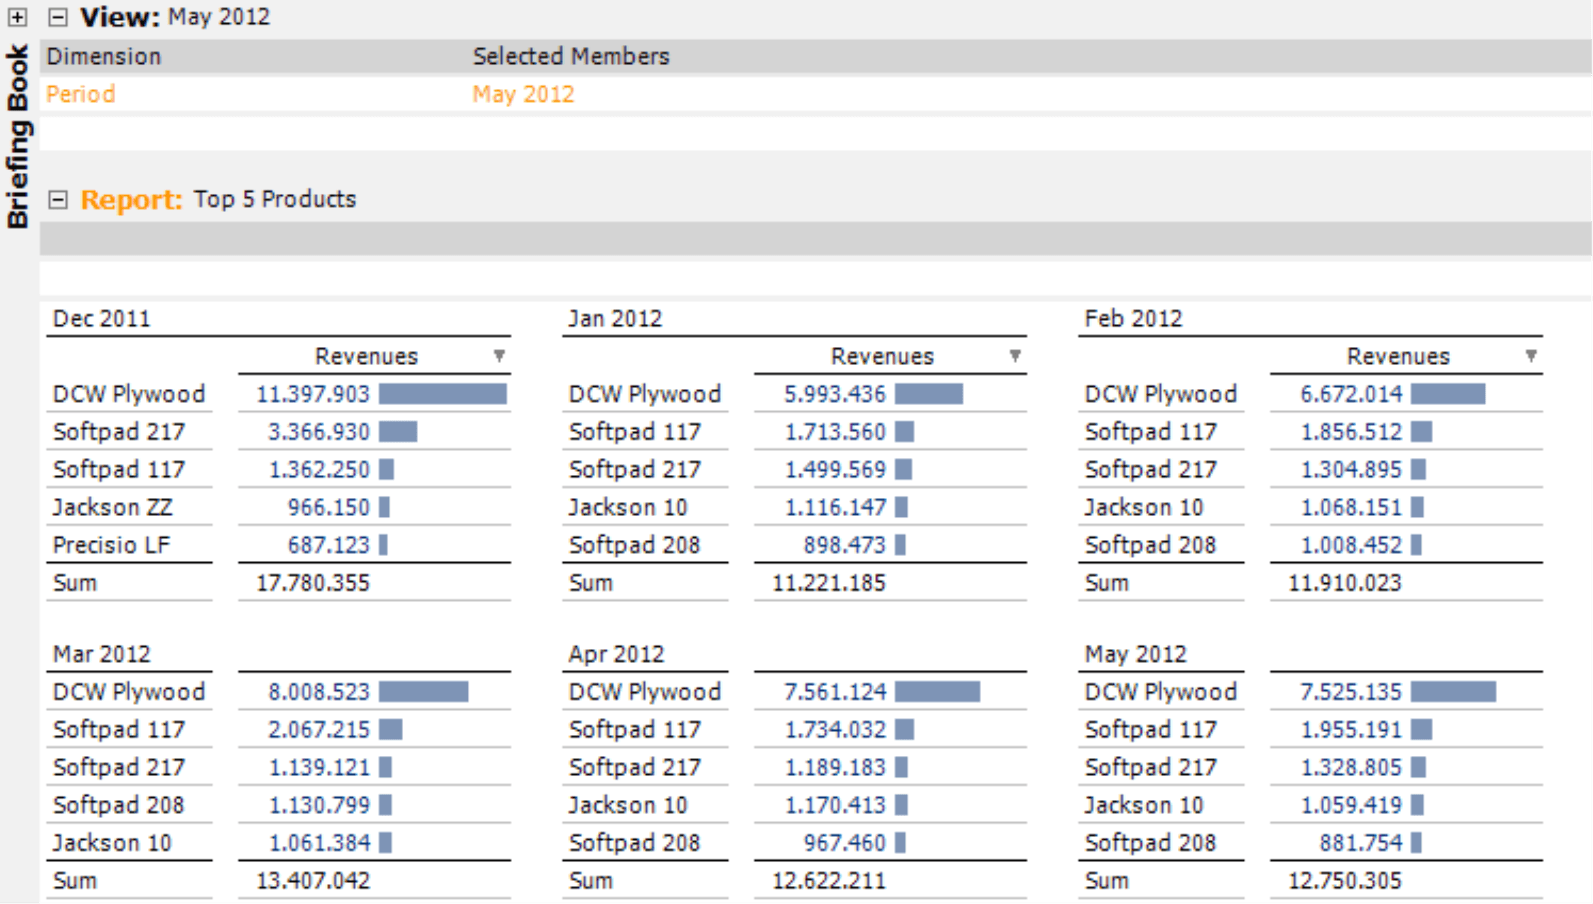
If you select a month, the report will contain six months – as defined. In the screenshot below, you can clearly see why a pivot table would have had problems displaying the top five products for several periods. In December, for example, “Jackson ZZ” and “Precisio LF” are ranked 4th and 5th. In January, however, two other products (i.e. “Jackson 10” and “Softpad 208”) took those spots.
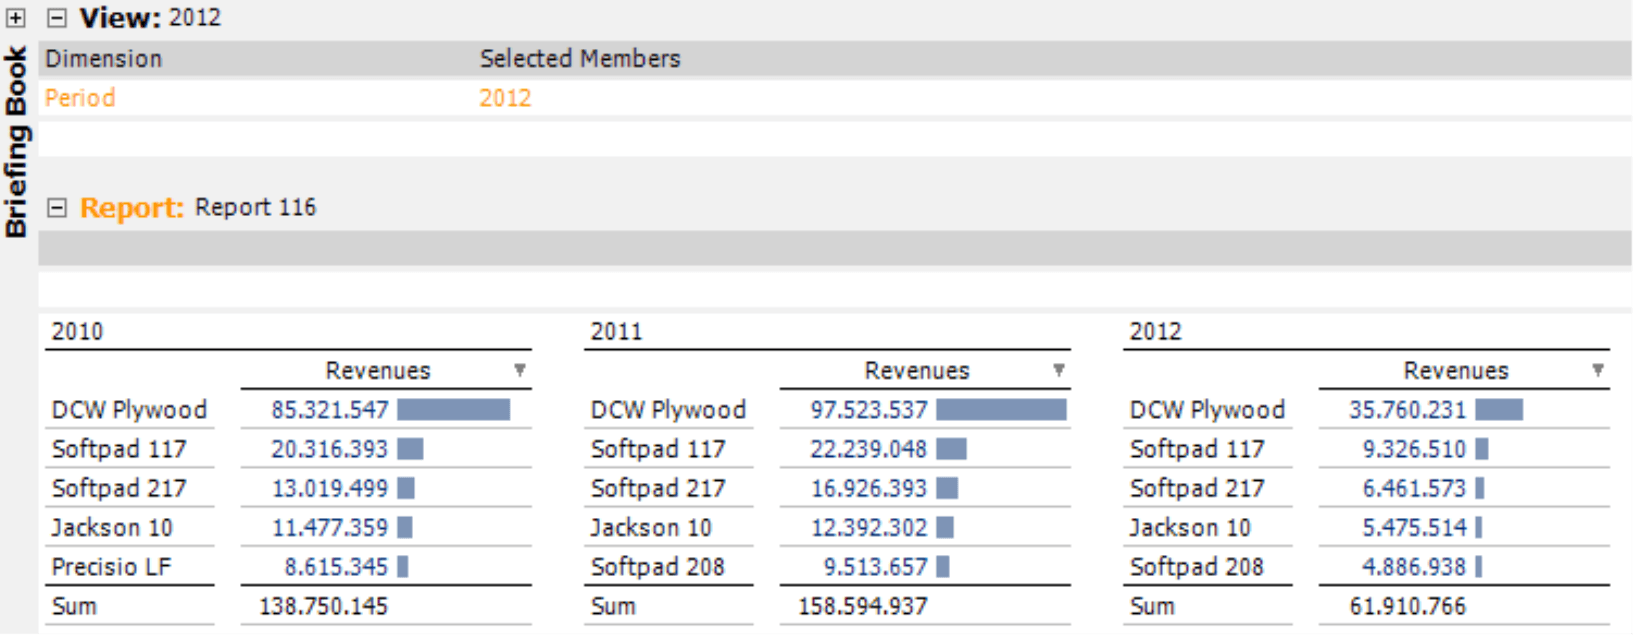
Now let’s look at the same report but with a different view – a quarter. Now you will see that the report contains a different number of multiples. The bars in the graphic tables use a global scale so that you can analyze the differences in the values across all of the multiples.
If you select a year, the number of multiples will change once again. This time, there are only three.
Small Multiples with analytically defined named sets
The previous example shows how you can define a named set that dynamically shows different numbers of members or members on different levels based on the current view. This way, a single report can show more or less detail. In addition to report consumers who want to take a closer look at the results in Viewer mode, this is a great relief for report editors as well because they only have to tend to the analysis one time. The named set allows a user to make a selection (i.e. the current member in the time dimension), which then determines which multiples the report should contain.
You can, however, use named sets for other tasks as well, especially analytic ones. A typical question in sales analytics is: Who are our best customers and which products do they want? To answer this, you now want to show the same top five products that you just iterated over several periods for several customers. Who these customers are, in turn, depends on the query because they vary depending on the period, market segment, etc.
Once again, you can use a named set in which you have saved the query for the best customers. Doing this is simpler now than it was previously because you don’t need to write the MDX expression yourself; you simply save it from a pivot table.
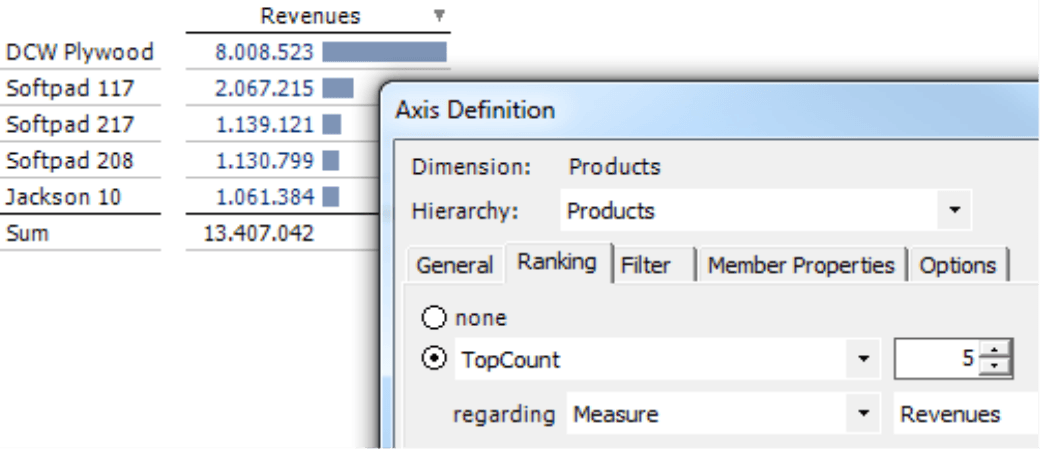
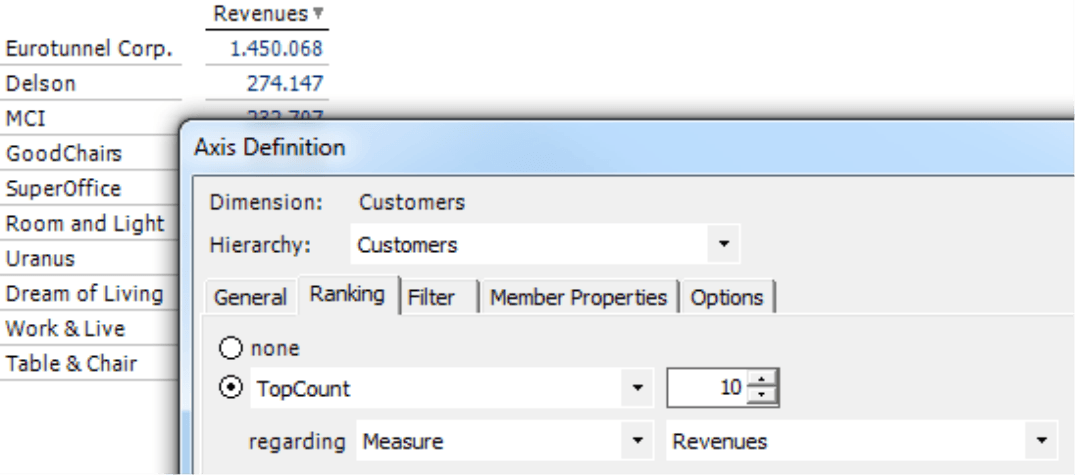
Let’s start by creating a pivot table with the “Top 10” from the customer dimension. In the Axis definition, simply select the desired level (i.e. “Customers”) and on the Ranking tab the order (i.e. “TopCount”).
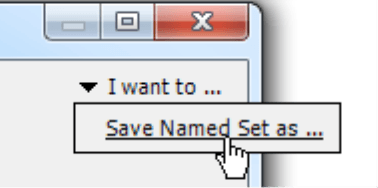
Now you can save this definition by selecting Save Named set as (I want to… menu in the Axis definition). In the Editor for named sets, you only have to enter a Name for the set in order to reuse the query.
You can use the named set to access other pivot tables, make calculations in MDX expressions, and iterate Small Multiples – as well as copy (starting in DeltaMaster 5.5.4), rename, or reuse it in Named set browser (Model menu).
Let’s look at the report you just created in Viewer mode.
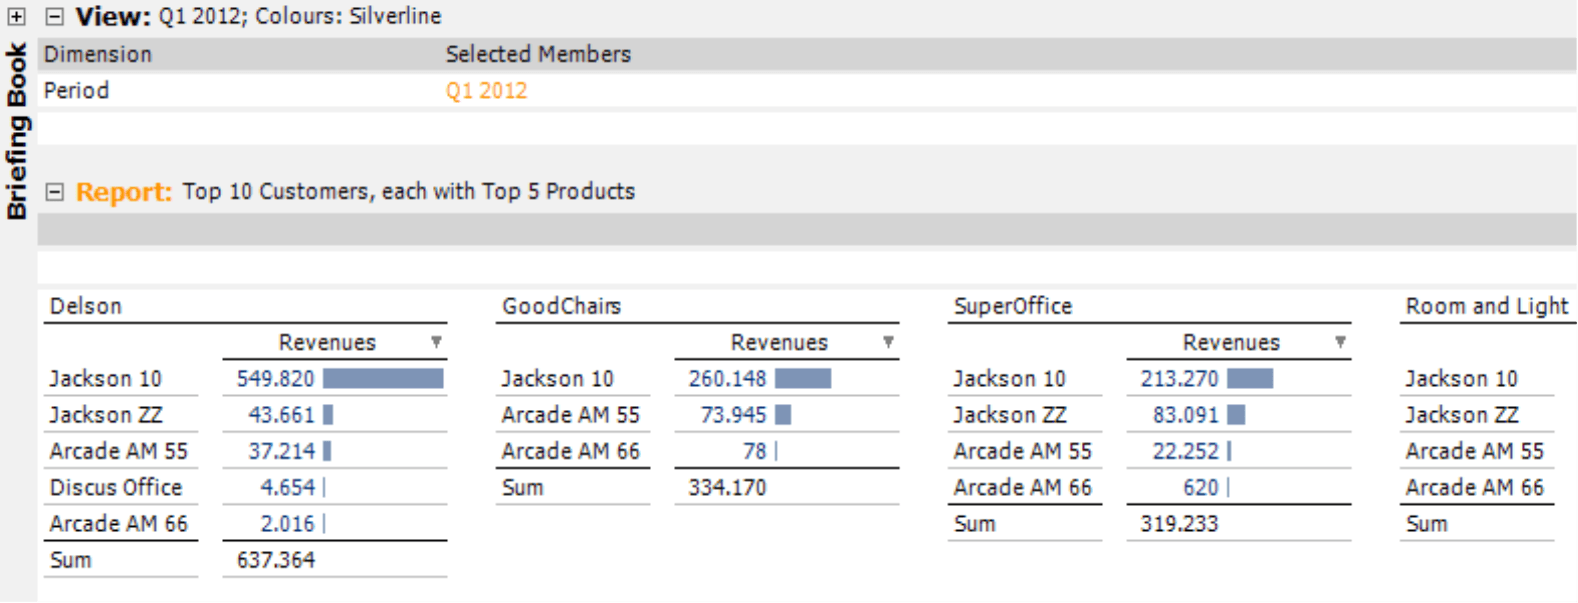
In Q1 2012 (and for the color “Silverline“), the best customer was “Delson” followed by “GoodChairs”, “SuperOffice”, and “Room and Light”. This report shows the customers ranked by their revenues in this quarter (and for this color) as well as the top five products by revenues for each of these customers.
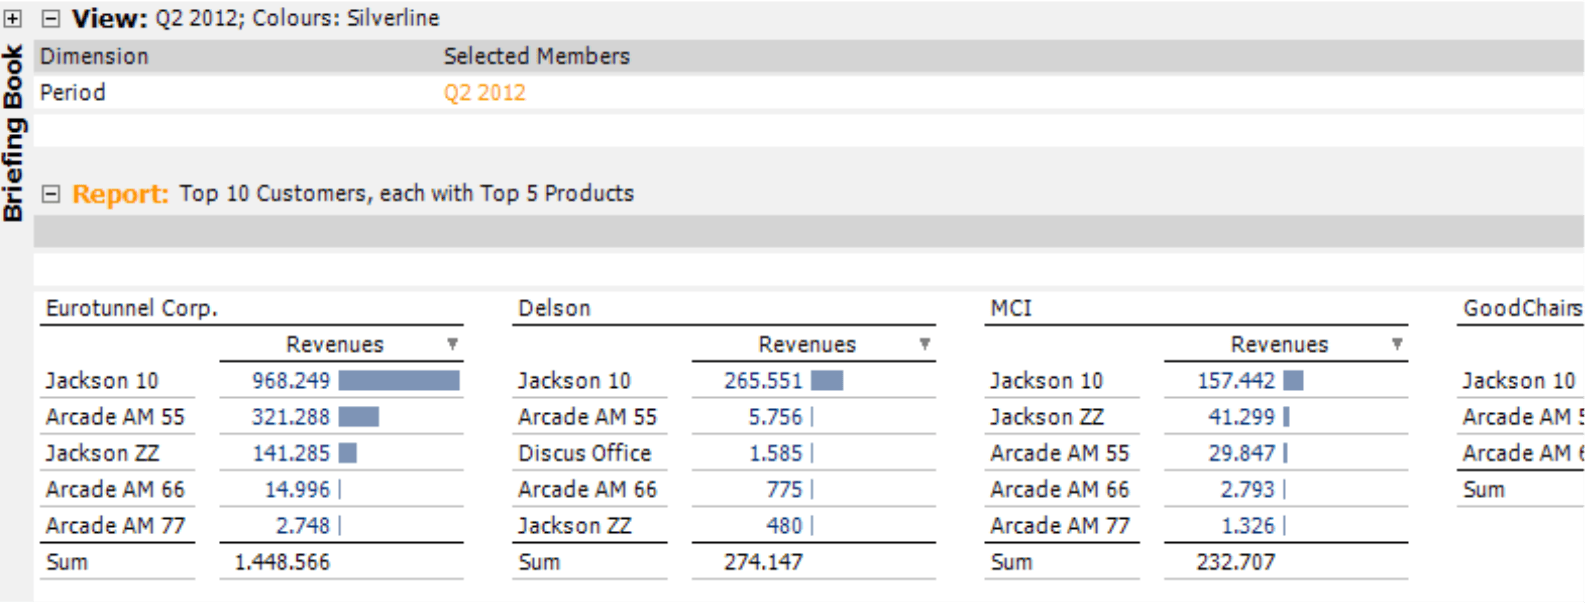
Business in Q2 2012 (and for the same color), however, was different. The best customer was “Eurotunnel Corp.” while “Delson” and “MCI” ranked second and third respectively. Different customers, different order – but once again the report ranks customers by revenues in this quarter (and for this color) as well as the top five products by revenues for each of these customers. This report, therefore, contains two rankings nested in each other – a ranking of the customers and a ranking of those customers’ favorite products.
Repeating repetition
This edition of clicks! has introduced three different ways to define dynamic comparisons with Small Multiples. In order to create these reports, you will need a Miner Expert license or a separate one for Small Multiples. To receive a trial license, simply contact us. As usual, you can use any saved Small Multiples report in all other user levels without needing any special license. That means, you could publish it in Reader mode, access it in Viewer mode with varying views, iterate it again by countries, companies, cost centers, etc. in ReportServer, and so on. Now, that’s what we call dynamic!
Questions? Comments?
Just contact your Bissantz team for more information.
