![]()
Greetings, fellow data analysts!
The first bicycles as we know them today date back to the 1860s. Back then, riding a bicycle must have been very difficult; not only were they extremely heavy, but they also had a fixed gear ratio that could only be changed by taking off the rear wheel. It took decades until the shifter was invented – the patent for the first hub gear from Wanderer in 1902 and the invention of the derailleur by Campagnolo around 1930 were both major milestones. Shifting gears makes biking efficient because cyclists can constantly adapt the amount of energy they exert to the terrain, desired speed, or their own level of fitness without having to stop or dismount. We like to compare our user-level concept in DeltaMaster to the gears of a bicycle. From Reader to Miner, you can choose from several different levels to adapt DeltaMaster to your analytical tasks. This edition of clicks! will focus on Analyzer mode, which is designed for users who want to move up a gear from Pivotizer mode and efficiently analyze their data without too much effort.
Best regards,
Your Bissantz & Company Team
Pivot tables are the tool of choice for many information needs in financial controlling. First of all, they are simple to maintain, dense in data, and easily automated. Users can interactively decide which details they would like to see as well as how many. When displayed as a graphical table, they show relationships between and developments of values in a clear, compact manner. Nevertheless, interested users who want to take a closer look at their data sometimes need specialized methods. As you already know, DeltaMaster’s Miner mode provides a comprehensive library of analytical methods that you can even combine together (Threaded Analysis Technology). Yet, you can already leverage some universal and pragmatic standard methods in Analyzer mode. In the following section we will present the advantages and special features of this user level.
More powerful than Pivotizer yet simpler than Miner
In DeltaMaster, Analyzer is the user level between Pivotizer and Miner. This fact alone gives you a pretty good idea of how and where you can use it. It is designed for users who want to interactively analyze their data beyond using pivot tables without having to deal with the numerous parameters and options that experienced analysts, report publishers, and application owners need for their work.
- Analyzer mode offers the full functionality of Pivotizer plus additional features. That means that you can create and edit pivot tables in Analyzer using the complete range of analytical features such as rankings, filters, in-cell graphics, and sparklines. Beyond that, Analyzer also offers the Pivot Navigation and further analytical methods (i.e. Ranking, Cross Table Analysis, Concentration Analysis, Time Series Analysis, and Portfolio Analysis). Accordingly, Analyzer is targeted at advanced users who want to use the information in a pivot table or other reports as the starting point for specialized analyses or ad hoc investigations.
- Analyzer offers less functionality than Miner mode. Miner provides the Pivot Navigation and all of the analytical methods in Analyzer plus many more methods that you can only access in Miner mode. In Analyzer, all of the analytical methods are fully automated because it is targeted at users who want an easy-to-use tool and don’t need functionality for threaded analysis. In other words, Analyzer mode keeps the application as simple as possible – to access the full settings and parameters of the analytical methods, you need to use Miner mode.
In DeltaMaster, users can access all reports on every user level – even if they were created in a higher one. As a result, you can open Flexreports, combination cockpits, and other analyses in Analyzer, even though you cannot create them on this user level (i.e. only in Miner mode). Reader, Viewer, and Pivotizer users, in turn, can also access reports that were created in Analyzer mode.
Starting an analysis with drag and drop
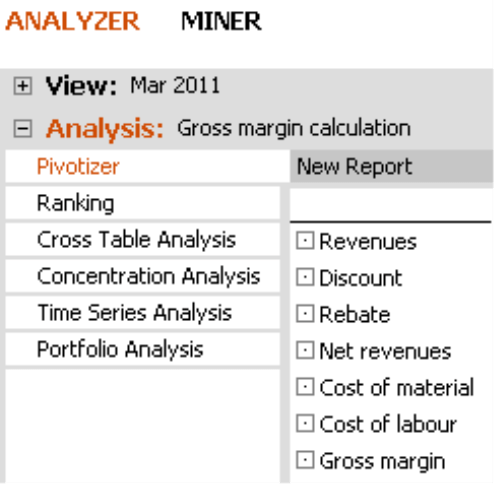
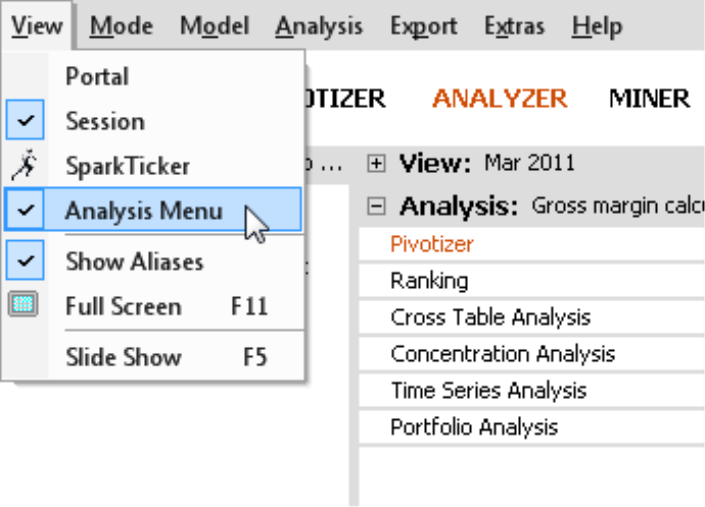
The analytical methods are listed in the Analysis Menu, which is located on the left side of the Analysis window. Since you start the Pivot Navigation directly from the pivot table, it is not listed as one of the methods. You could save room by hiding the entire Analysis Menu (main menu, View), but this screen space is actually well invested because you can use the Analysis Menu to open an analytical method and directly ‘fill’ it with a measure from a pivot table or Flexreport.
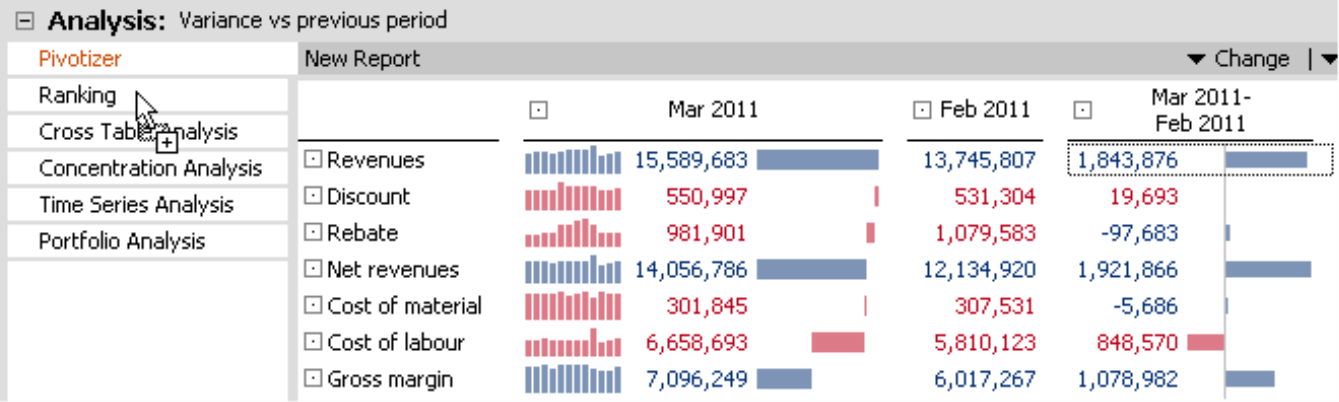
Following these steps, you can quickly turn the gross margin calculation on the right into complete revenue statistics by simply dragging the revenue value and dropping it into the Ranking row of the Analysis menu.
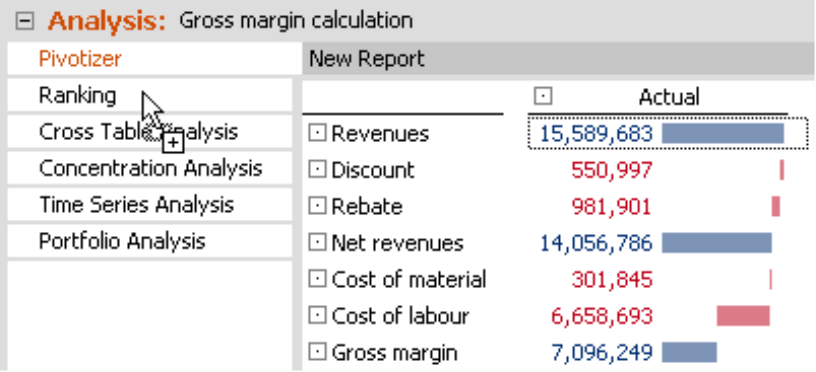
As soon as you drop the value, DeltaMaster will calculate the selected analysis – and you immediately get the desired revenue statistics.
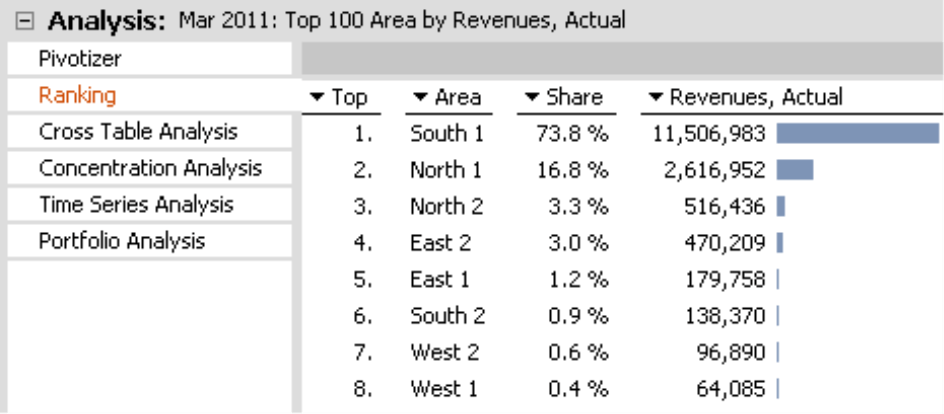
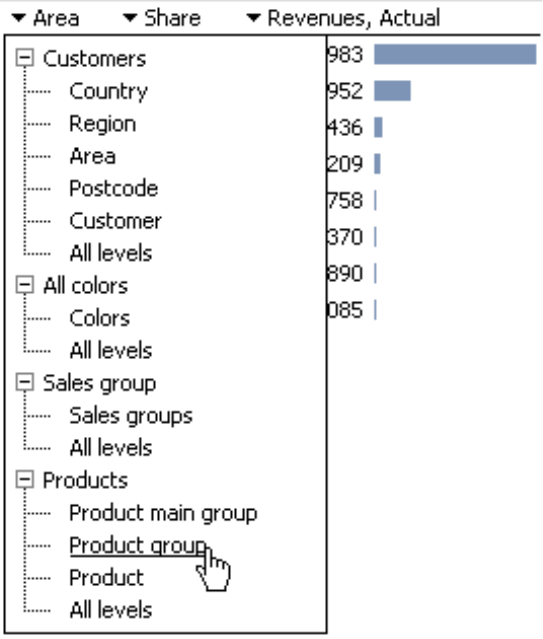
The triangles in the column headers indicate that you can change the respective report components. In other words, you could also calculate a Ranking for another level, all levels, another hierarchy, or another dimension (e.g. for product groups).
Unlike in Miner mode, you do not have to recalculate the analysis. As soon as you have selected another level or measure, DeltaMaster will automatically start the work. This helps make using Analyzer mode so fast and easy.
Selecting measures
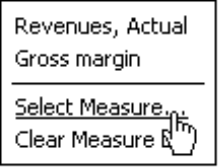
Instead of dragging and dropping a measure into an analytical method, you can also Select [a] measure. This function opens the Measure browser, where you can Create [a] new measure (if necessary) using the same rich options that you have in Miner mode. In contrast to Miner, however, you can only ever select one measure. For a Portfolio Analysis, which requires two or three measures, you can only drag and drop the first measure; the others must be selected explicitly.
In many cases, you don’t need to create a new measure. If necessary, DeltaMaster automatically does that for you when you drag and drop a value into an analytical method. For example, the screenshot on the right shows the gross margin calculation from earlier but in comparison to the previous period. Let’s say you want to know who you can thank for the revenue increase. To find out, you drag the absolute variance versus the previous period (i.e. 1,843,876) and drop it into the Ranking row.
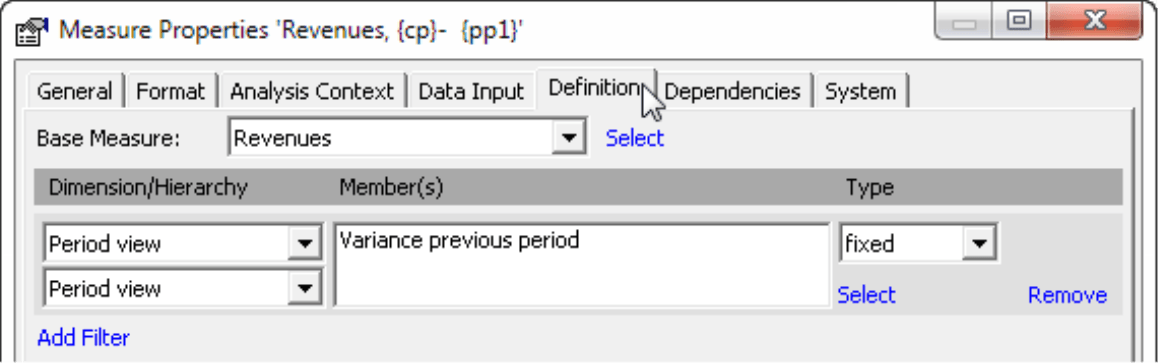
DeltaMaster now recognizes that a filter value is needed to limit the measure “Revenues” to the member that indicates the variance to the previous period. First of all, DeltaMaster goes through the list of measures and checks if that type already exists. If the answer is yes, it will open the selected analytical method (in this case, the Ranking) with precisely this measure. If this type of measure doesn’t exist, DeltaMaster will create it for you and open the analytical method with the new measure.
You can see the results of this analysis in the screenshot below. Here, we have displayed the Top and bottom members together to show the customers with the highest revenue growth and those with sharpest revenue decline.
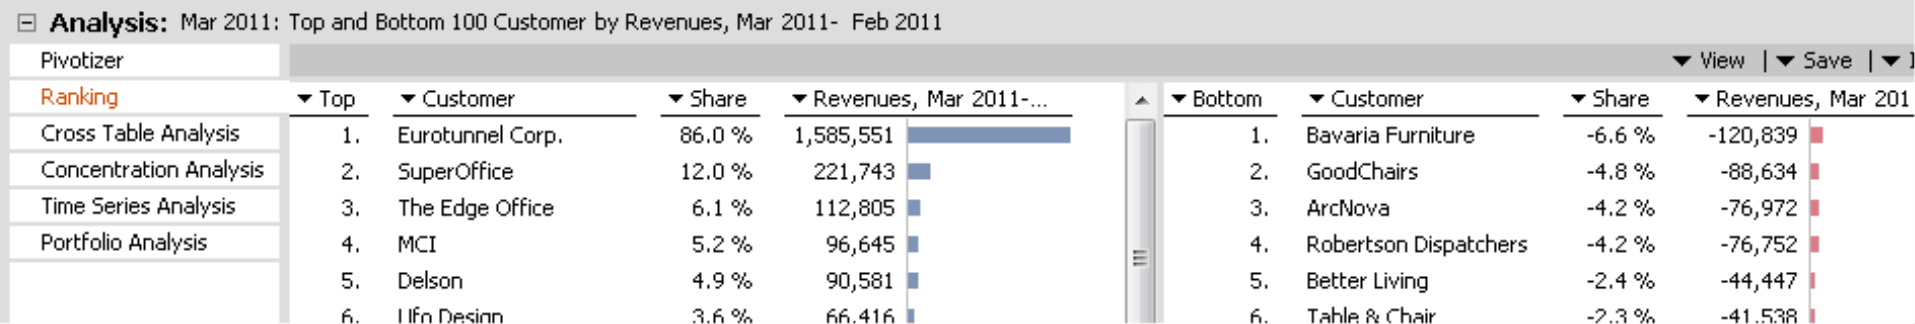
Based on this example, you can see how useful the specialized analytical methods in Analyzer are. You could have sorted the customers in a pivot table as well – but not in two directions (i.e. not ascending and descending at the same time).
Measures can be transferred this way in pivot tables and Flexreports that are saved as a report and in pivot tables and Flexreports that are embedded in a combination cockpit that is saved as a report.
No configurations or threaded analysis
Analyzer is designed to be extremely simple to use. In fact, you can use all the analytical methods in Analyzer without needing the Settings menu, which is used in Miner mode for fine tuning. The functions in the context menu or the I want to… menu, however, are the same as those in Miner mode. In the Time Series Analysis, for example, you can activate the Logarithmic Scale for the Y axis, add a Trend Line, change the Step, or display the Start and End Values, the Minimum and Maximum as well as the desired Differences (see Properties in the context menu or in the I want to… menu).
In the Concentration Analysis, you can change the class boundaries by dragging the thresholds in the chart using the mouse.
Threaded Analysis Technology is another analytical method that is only available in Miner. Using this method, for example, Miner users can create virtual hierarchies or transfer a member from the analysis results into the View with a double click. This functionality is not supported in Analyzer.
Pivot Navigation
The Pivot Navigation is very valuable for detailed analysis (see DeltaMaster clicks! 10/2007 for more information). Unlike the other analytical methods described above, you start the Pivot Navigation directly from a pivot table. You can use this method, which is only supported in Miner und Analyzer, to disaggregate measures step by step in order to see how a determined revenue or variance originated or how it is broken down among the (largest) members of a certain dimension or hierarchy level.
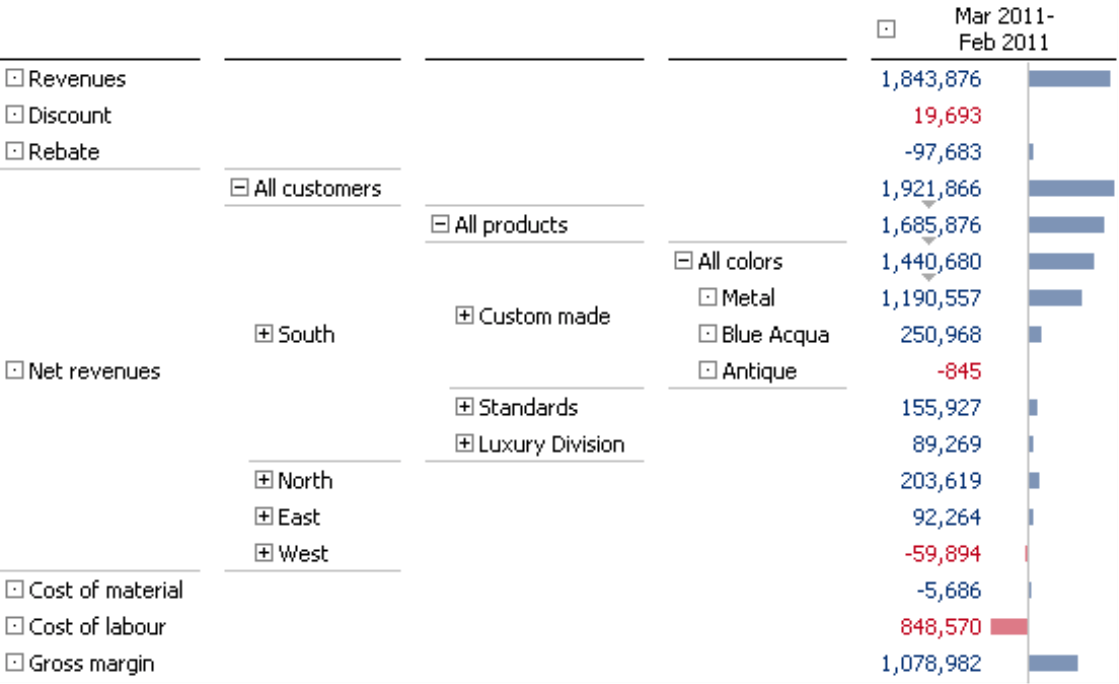
In the example on the right, you can see the variance for net revenues compared to the previous month. The first step differentiates the variance by customer regions. In the region with the largest variance (i.e. South), the variance amount is again broken down – this time, by product groups. ”Custom-made”, the product group in South with the largest contribution to the variance, is in turn split into “Colors”. With each additional column, the visualization becomes more specific, thus allowing you to close in on the underlying causes in just a few, logical steps. Since the table only drills down on one member in each step, you can examine many different criteria in the analysis and still maintain a clear overview. In a pivot table, expanding the dimensions would quickly cause the table to explode in size.
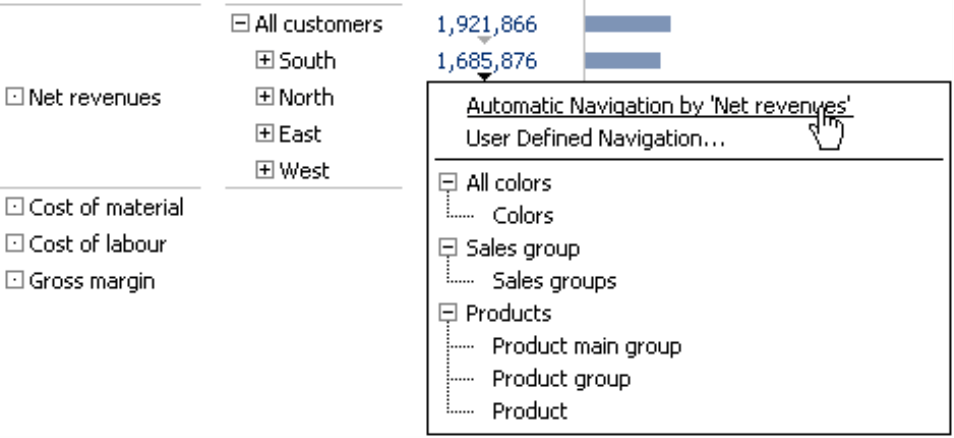
You can decide for yourself which direction you want the analysis to take or which dimension you want to see next – or you can let DeltaMaster guide you by using the integrated automatic navigation (one of the data mining methods in Miner mode).
Analyzer for Miner users
Since working in Analyzer is so comfortable, even so-called “power users” who normally work in Miner mode switch to Analyzer every now and then. The Pivot Navigation, for example, has the exact same functionality in Analyzer and Miner levels. Analyzer, however, doesn’t differentiate between a cockpit and a report. The main workspace is divided into just two windows (View, Analysis) and not three as in Miner (View, Cockpit, Analysis). This saves space on your screen and looks ”tidier” as well. Some users also feel that it is easier to generate reports when working directly in the report instead of administering cockpits and reports in parallel. In this case, users may wish to leave their trusted Miner mode for a short period and perform certain tasks in Analyzer.
Questions? Comments?
Just contact your Bissantz team for more information.
