![]()
Greetings, fellow data analysts!
Long-term developments and trends that affect or are affected by daily business are an important foundation for making management decisions. Yet, it’s often not easy to recognize them – especially when your business changes from day to day or even throughout the course of the day.
When you collect data every hour or minute, you often get unsteady patterns which makes it difficult to detect the base lines. One option to cope with this situation is to use trend lines, which level the ups and downs of the observed period into a straight line. If you prefer a more gentle approach to iron out the differences, moving averages offer a viable alternative. Either way, you will certainly find a few helpful tips in this edition of DeltaMaster clicks!.
Best regards,
Your Bissantz & Company Team
A value really only becomes interesting when you compare it to one or more numbers. One highly informative option that you can almost always use is a time comparison. How are our revenues, sales, incoming orders, and capacity utilization fairing today – and how did they previously? In this edition of DeltaMaster clicks!, we would like to present a special type of time comparison: the moving average. With moving averages, you can iron out the bumps in a time series with large, random peaks without the outliers limiting your view of the overall developments. We will discuss when you can use this approach as well as when you really shouldn’t in the sections below.
Let’s start with how you define moving averages in DeltaMaster and how you work with them.
Variable start and finish plus a constant length
When we call something a moving or rolling average, we are referring to an average that is calculated from the values of a time period with a constant length and a variable start and finish. In other words, it includes the last twelve months starting from the current month and not just the values from January through December. The ‘current’ month, for example, could be the one that is selected in the View window.
Defining moving averages
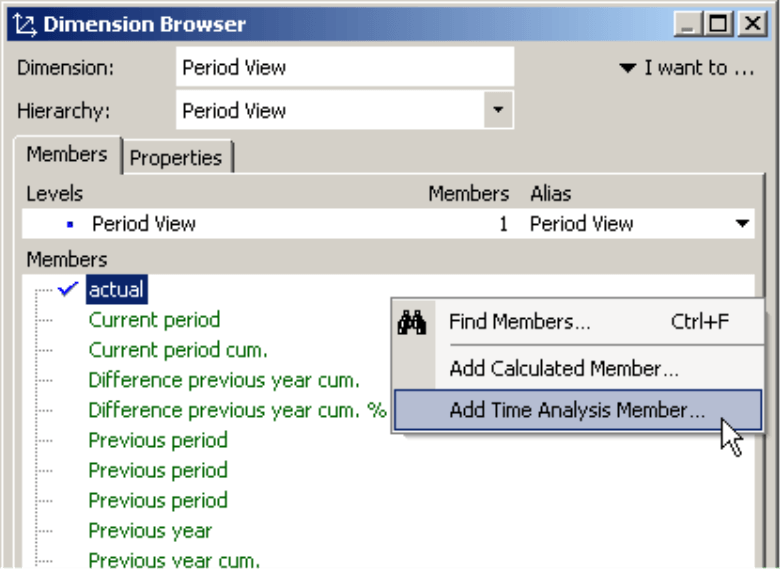
In DeltaMaster, the easiest way to define a moving average is to use a Time analysis member (see DeltaMaster clicks! 08/2007), typically in a help dimension that is designed for time comparisons (e.g. ‘time utility’, ‘presentation’, or ‘period view’). To Add a time analysis member, simply go to the Dimension browser of this dimension and select the respective command from the context menu or the I want to… menu.
Now, go to the Editor for time analysis members (see screenshot on the following page), select Query as the Calculation type (middle, left), and choose Moving aggregates (bottom right). Besides the average, you could also select the sum as an aggregation function as well as the minimum, maximum, standard variance, variance, or the aggregation that is designated in the OLAP database for the measure in which you want to apply the time analysis member. The following section, however, will only concentrate on the ‘average’ option.
As an additional parameter, you could also define the Level where DeltaMaster should retrieve the measures. If you want to calculate moving averages on multiple levels (e.g. hours and days), you simply create a separate time analysis member for each desired level.
You can also determine how many time periods flow into the average, in other words, the length of the desired stretch of time (e.g. three months). In this case, DeltaMaster will count the current month (or the reference member, see below). Three months, therefore, means the current month, the previous month, and the month before that. In general, a longer time frame results in a stronger damping effect, and the outliers do not play as large of a role.
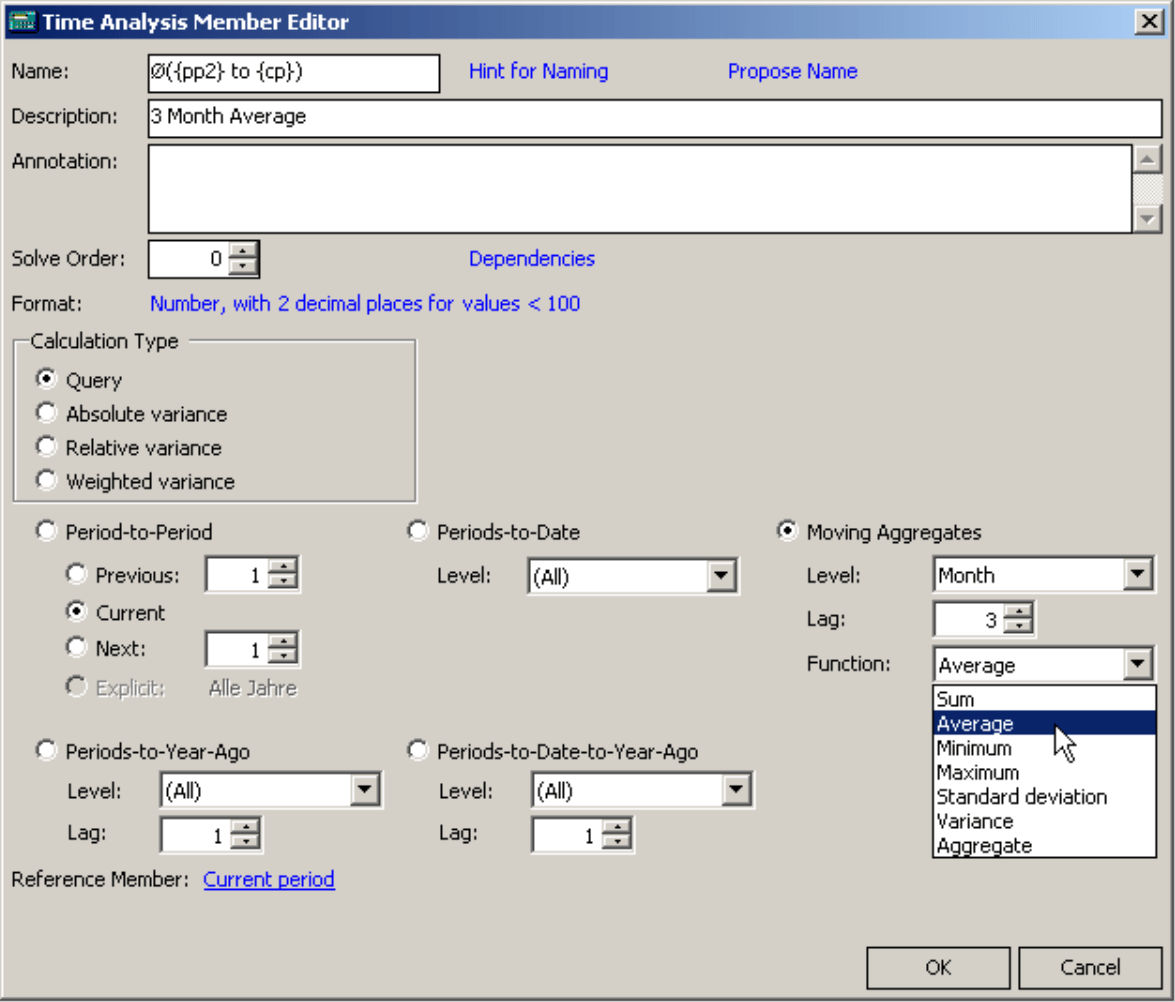
Under Reference member (bottom left), you usually select the (default) member for the current period (e.g. ‘current’, ‘running’, ‘actual’).
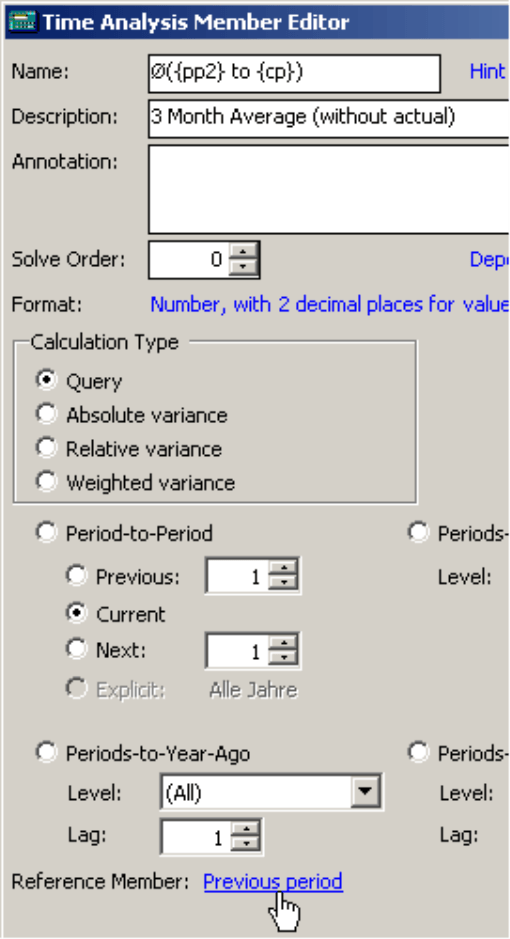
To complete the definition of a new time analysis member, you can ask DeltaMaster to Suggest a name (link in the upper-right part of the dialog box next to the entry field for the Name). When suggesting a name, DeltaMaster will automatically enter variables for the first and last observed month. In the screenshot above, these are ‘{pp2}’ for the ‘previous period’ with a lag of 2 and ‘{cp}’ for the ‘current period’. DeltaMaster will then automatically replace these variables in cockpits and reports with the currently valid time period. This makes cockpits and reports easier to understand and saves you from having to update the labels later on. You can, of course, change the suggestion or write over it with a different name just like you can with all time analysis members and other calculated members. If you would like to Enter a special character as a symbol for the average, simply select the respective command from the context menu of the input field for the name.
You can also opt to write a Description for documentation purposes as well as an alias which DeltaMaster can display in place of the actual name in selection lists so that you can find this member more easily. To activate this feature, select the option For calculated members display the description instead of the name in selection lists, which is located in the Hierarchy properties of the Dimension browser (I want to… menu).
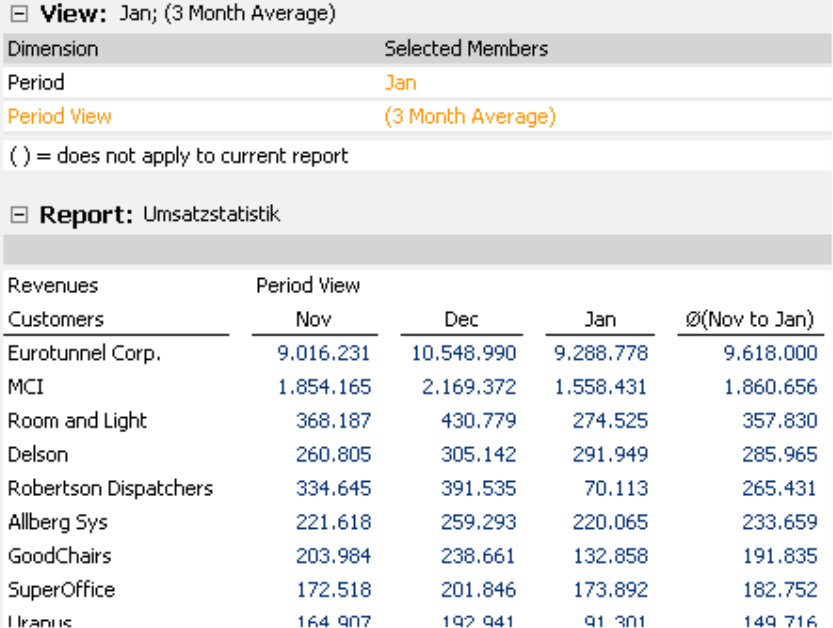
In the screenshot on the next page, we have entered the new member to the revenue statistics over the past three months. All of results and labels shown here depend on the current period.
As a DeltaMaster user, your objective isn’t just to display the average. To the contrary, your analysis is just getting started! If you are working in Analyzer and Miner mode, you can now transfer the average values to other analytical methods.
In the next section, we will present two other commonly used application scenarios: determining the variance between the current value and the average as well as visualizing the moving average as a sparkline.
Deviating from the average
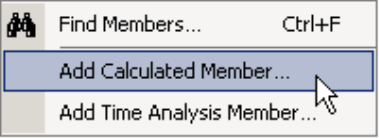
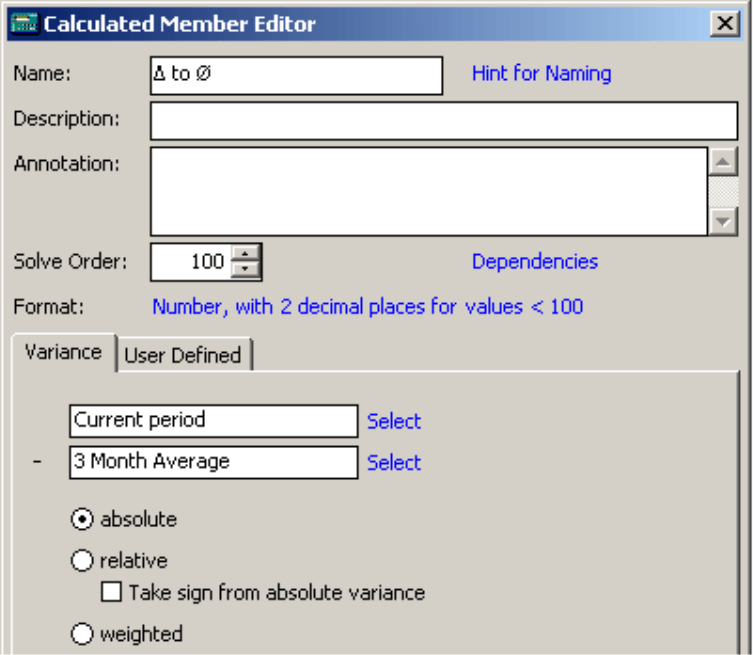
In order to examine how the current value deviates from the moving average, you will need to define a further calculated member in the same dimension (e.g. ‘period view’, ‘time utility’, ‘scenario’). Now you just need to calculate a simple variance between the current value and the average. To do this, you don’t need to use the Editor for Time analysis members any more. You can just Add a calculated member to the Dimension browser.
In the Editor for calculated members, you can select which member should be subtracted from the other. Again, you can easily add special characters in the Name field using the context menu of this entry field.
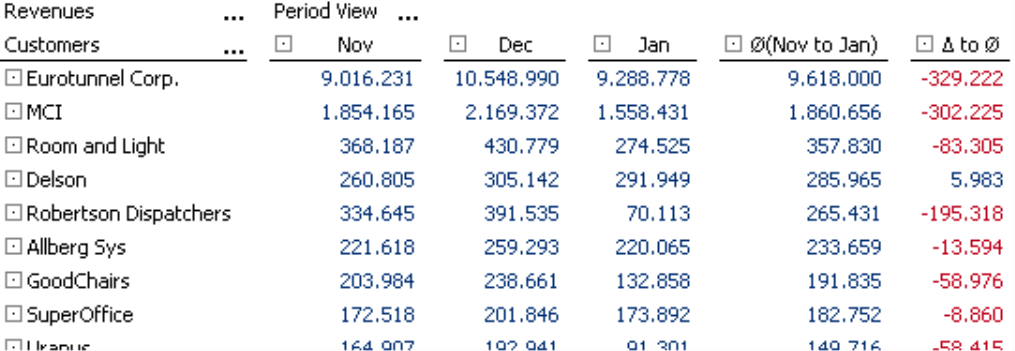
If you now add the variance to the report, you will quickly see which customers are now generating less revenue than in recent times. To analyze these findings more thoroughly, you can transfer this variance into other analytical methods as usual or dissect it using the Pivot Navigation (see DeltaMaster clicks! 10/2007).
Above-average sparklines
Sparklines are ideal for analyzing trends such as moving averages. Oftentimes, you work with moving averages because you want to filter out the short-term, unsystematic events in daily business so that you can recognize larger trends and the developments behind them. And sparklines are a tried-and-true way to identify, compare, and analyze them.
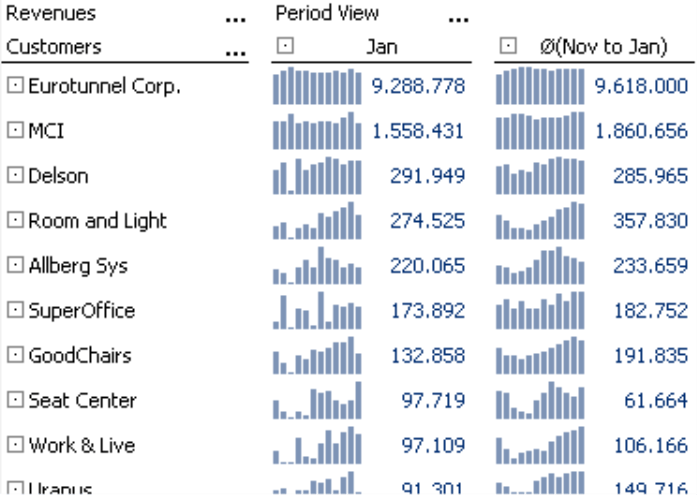
In the screenshot on your right, we have reduced the report that you have seen before to the columns for the current value and three-month average. The displayed sparklines run over twelve months and have a somewhat larger format than the standard size (20 pixels high, 3 pixels wide; for more information on setting the size, please refer to DeltaMaster clicks! 04/2011).
To make the effects of the moving average even clearer, we have zeroed in on individual sparklines and enlarged them. You can see that this closes smaller ‘gaps’ in the sparkline, levels out any protruding columns, and harmonizes distributions.
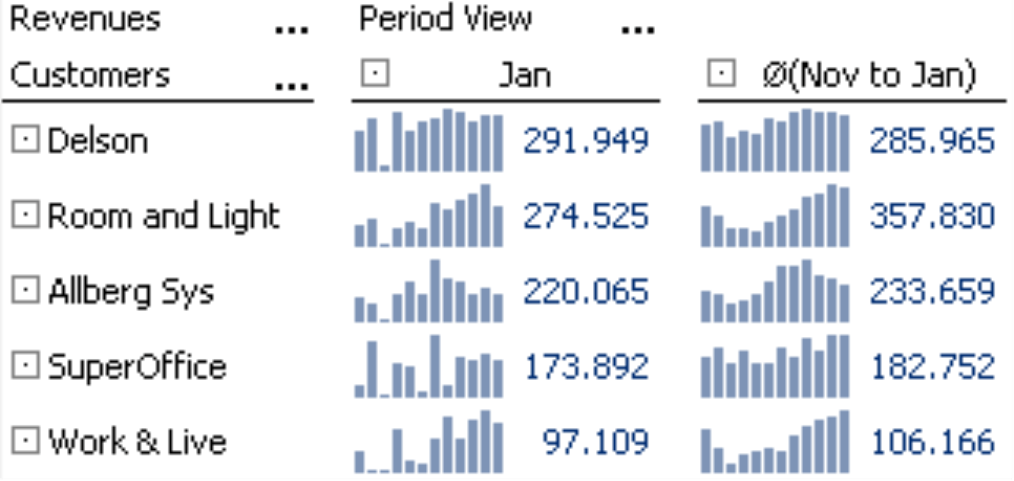
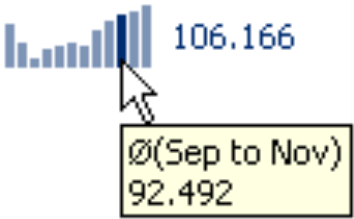
If you take notice in the sparkline of the average values, each small column stands for an average value. The last columns (both on the right) symbolize the average of the months from November 2009 to January 2010 as they are listed in the column header. The previous columns represent the average from October to December 2009, the ones before that stand for the average from September to November 2009, and so on.
If you used DeltaMaster’s suggested name or the given variables, you can view the respective period as well as the value for each column as a tooltip.
Average without the current period
In many applications, you need to create an average without including the current period so that the comparative value (i.e. the average) isn’t influenced by the current one. To do this, you only need to make one change in the definition of the time analysis member:
Under Reference member, select the previous period instead of the current one.
In most cases, the previous period is also a time analysis member that is already defined in the analysis session because this method of comparison regularly plays an important role in reports, cockpits, and analyses. If the previous period is not already defined, you can add it as an additional time analysis member.
The name of a time analysis member should reflect any changes to the reference member so that you can always identify which time period the member is describing. Since DeltaMaster currently does not take reference members into account when it automatically suggests a name, you will need to edit this name manually. You can change ‘{cp}’ for the current period to ‘{pp1}’ for the previous period. The start time frame also moves down one; for a three-month period, you will need to change the suggested ‘{pp2}’ to ‘{pp3}’. Once you make this change, the labels and values that are being processed will again coincide.
But take it easy…
People generally use moving averages as a simple way to iron out a data series with strong fluctuations. This calms the unsystematic and hectic ‘bumps’ in your daily business, so that you can focus your attention on larger developments that are looming behind them and recognize trends more easily. In general, moving averages are an option when the values are captured in short intervals, for example, every minute, hour, or day. This is very common in operative business departments such as production, service, warehouse logistics, or transportation logistics. As a result, certain information such as manufacturing contracts, quality data, or articles in an order that might be crucial for management decisions can also be hindering.
In many cases (but certainly not all!), it suffices to present your arguments on an average level. After all, not every peak means that you need to change the entire manufacturing or logistics system. Due to their calming effects, moving averages are also popular in forecasting. Nevertheless, there are many good reasons to display the ‘real’ values supplemented by averages, variances, or the development of the averages over time so that your readers can classify and interpret them more easily.
In other situations, it is very difficult to use average views. By ironing out several points in time, you automatically level out the positive and negative variances. This, however, makes them more difficult to detect – which was the actual point of our lesson. Whoever is interested in outliers or wants to analyze extreme values and gaps won’t come very far with an average alone. This can be helpful when you want to observe the variance to the average (see above) and visualize them with sparklines.
In addition, you should not use moving averages when you are dealing with longer periods of time, for example, quarters or even years. In these cases, you should work with the original values and not ‘chopped’ ones. Over longer periods of time, these larger divergences could be systematic in nature. When values are condensed more strongly, the aggregation already levels out the data to some degree. And since moving averages would ‘cumulate’ the data a second time, they are not suited for cumulated values.
Questions? Comments?
Just contact your Bissantz team for more information.
