![]()
Greetings, fellow data analysts!
Nowadays, companies often want to get an overview of the developments on site. Where do our employees work? Where are we making money? Where are our offices, customers, patients, or service centers located? What are their surroundings?
Thanks to Google Maps, you can easily obtain a bird’s eye view of these and other factors. And with the new Location Analysis module in DeltaMaster, you can connect your business data to these visualizations in order to highlight not one but many different locations in Google Maps. We will show you how in this edition of clicks!.
Best regards,
Your Bissantz & Company Team
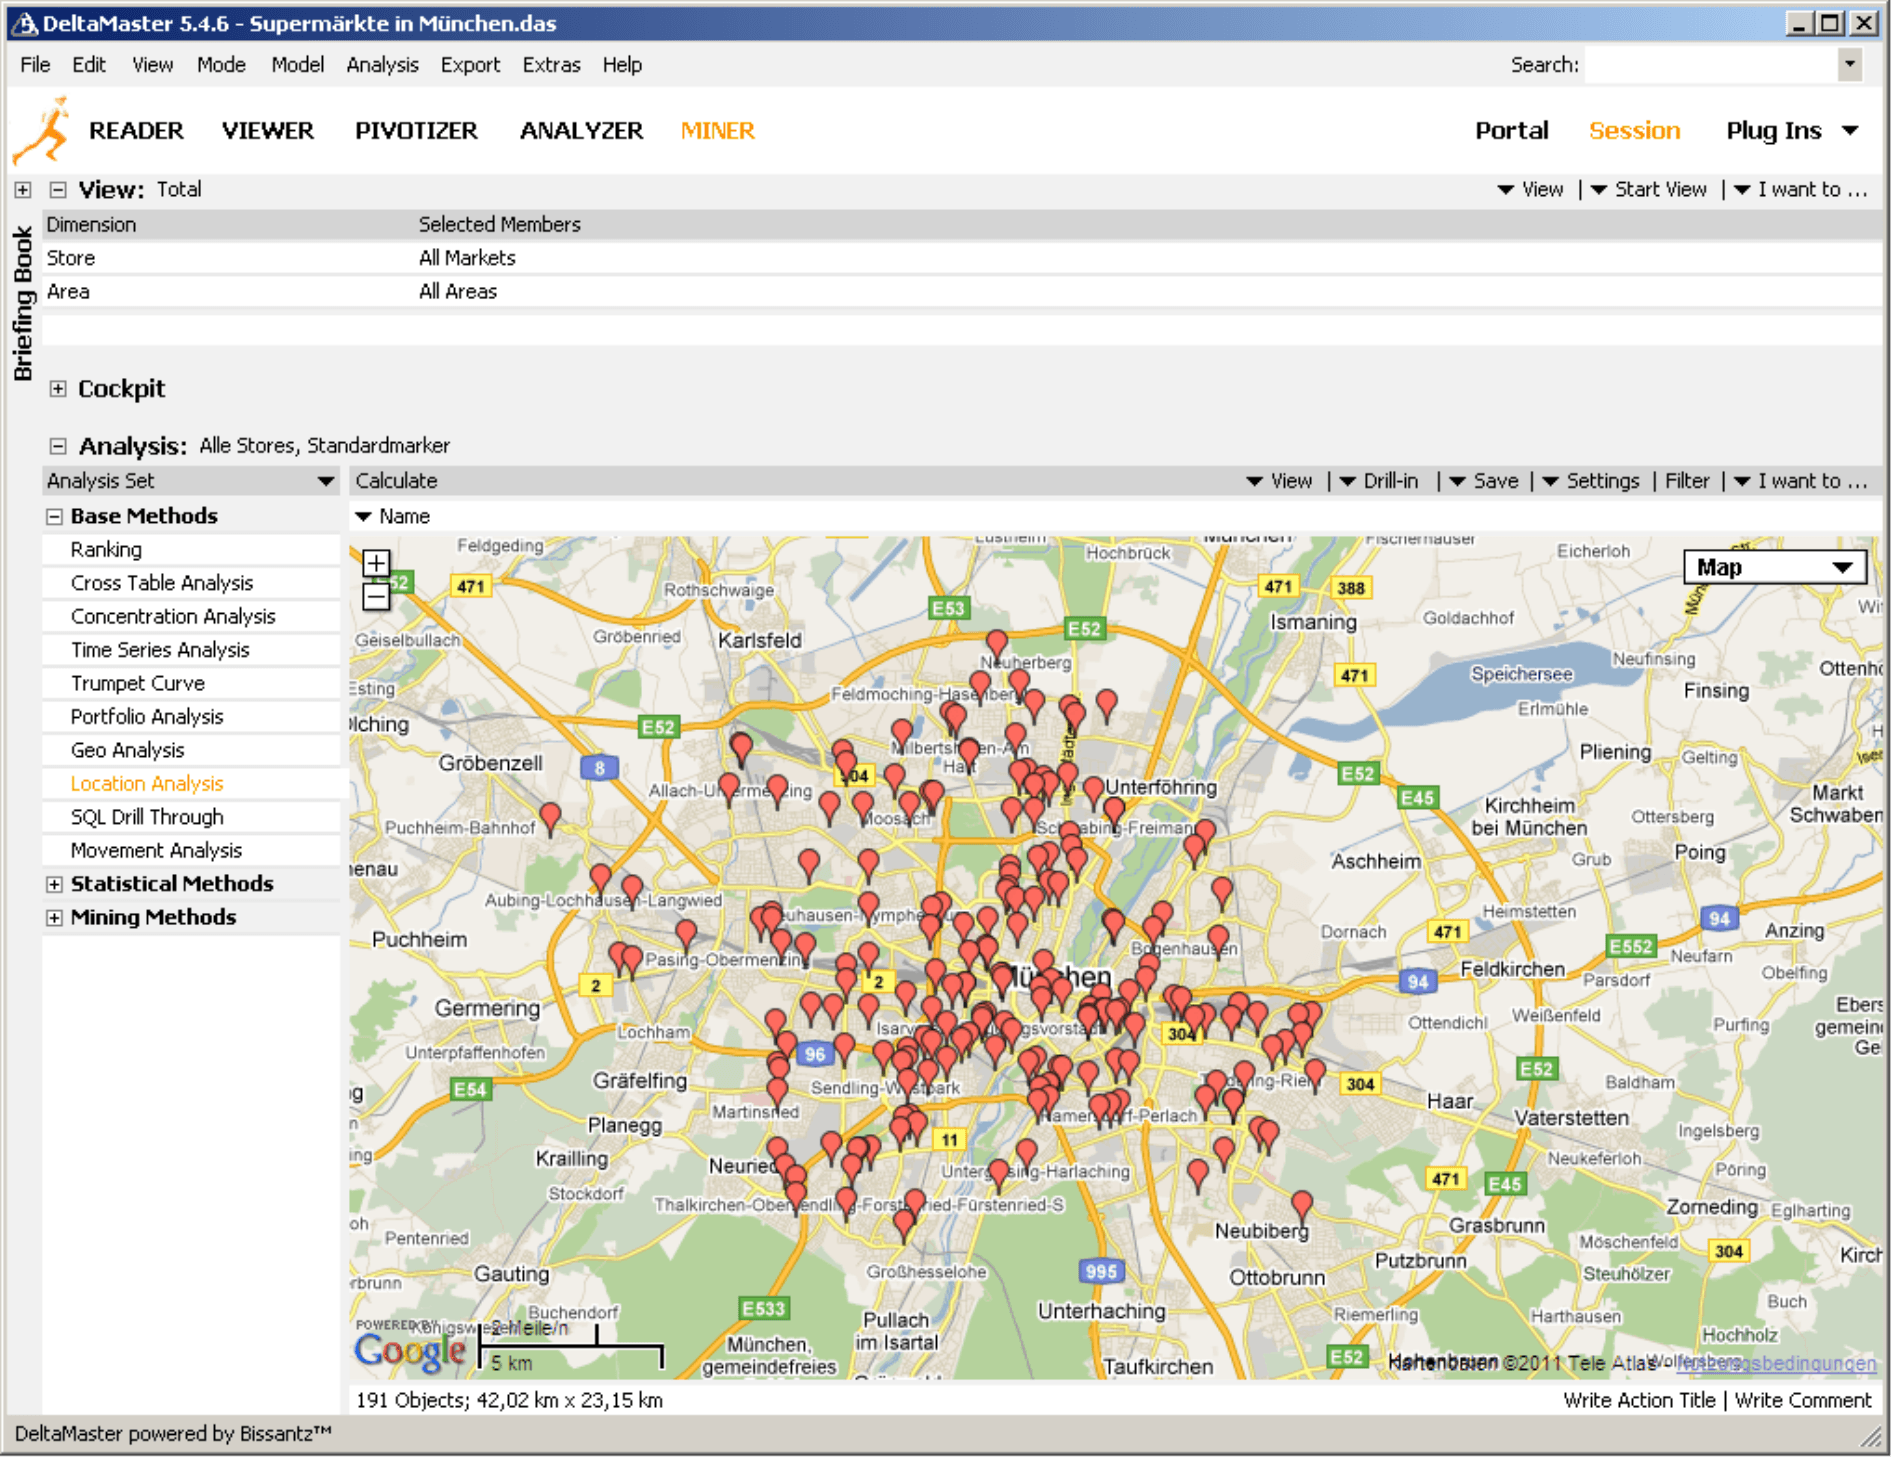
With DeltaMaster’s new Location Analysis module, you can literally put Business Intelligence on the street. This new analytical method, which debuted in version 5.4.6, integrates Google Maps into DeltaMaster. As a result, you can now display flags in Google’s electronic roadmaps or satellite images to show the location of offices, stores, customers, suppliers, service technicians, real estate, patients, and much more.
In DeltaMaster, Location Analysis is the second analytical method that you can use to examine geographical relationships. The first is Geo Analysis, which has been part of DeltaMaster for a long time.
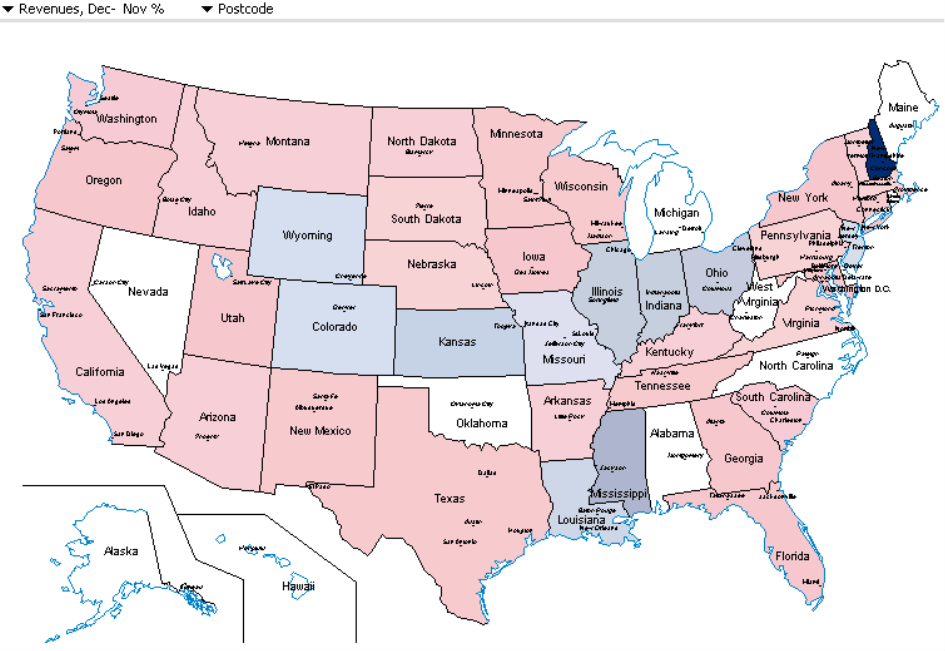
A Geo Analysis shows how a certain measure is broken down for a given area. The chart on your right, for example, compares current revenues to those from the previous period. This makes Geo Analysis ideal for evaluating measures by sales organizations, supply or sales markets, catchment areas, and other structures that pertain to a geographical area.
From a technical perspective, a Geo Analysis works with areas or polygons, while a Location Analysis works with geographic coordinates on a map. This module is especially useful for answering two types of questions:
- Distribution and concentration: You can easily see where something has happened in the map or satellite views of Google Maps. This makes it easy to identify large concentrations of flags in the map just by looking at them. A store chain, for example, may want to know which competitors also have stores in the vicinity of theirs. To do this, you would need to store these locations in your database, which is often not too difficult because their addresses are freely accessible. You can also estimate the distance between two stores.
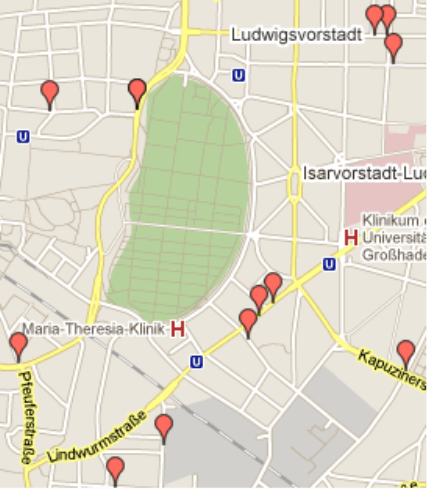
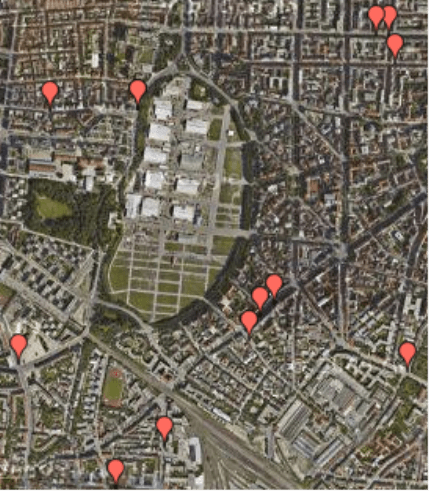
- On-site location: Sometimes, it is helpful to know what the location and surrounding area looks like. Can you access this location within walking distance from a train station, subway stop, public parking lot, or a tourist attraction? Are there any rivers, bridges, interstates, highways, or railroads nearby that can open (or obstruct) the route for pedestrians or vehicles? The satellite view of Google Maps is optimized for these and other scenarios.
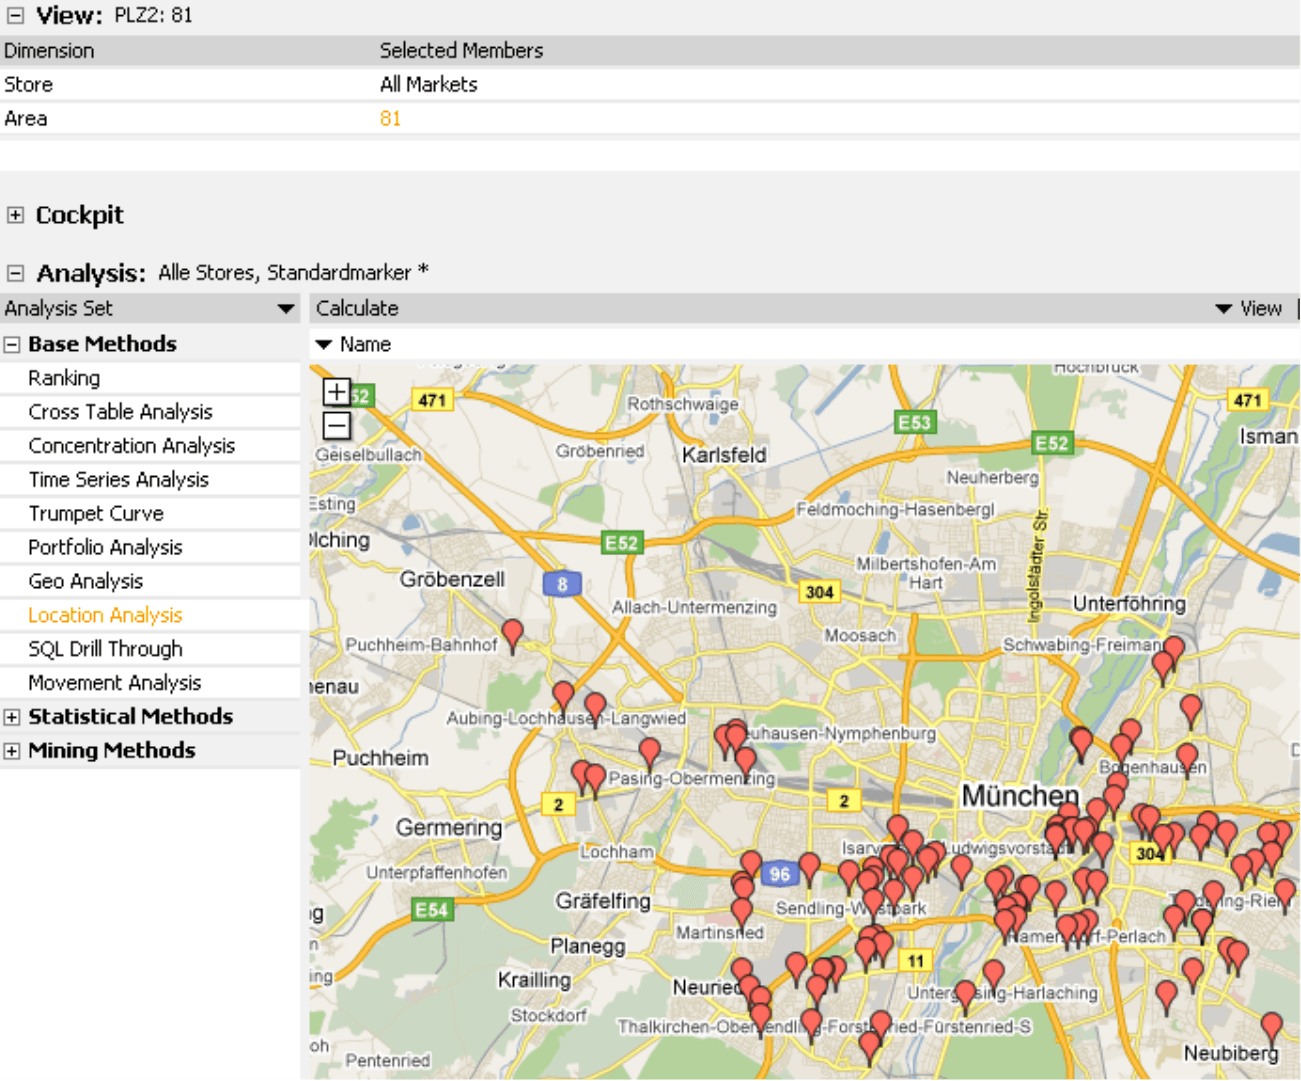
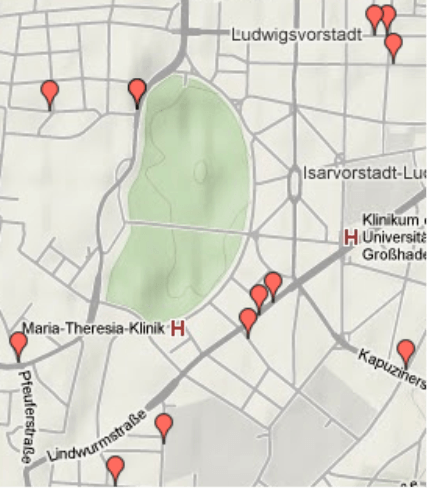
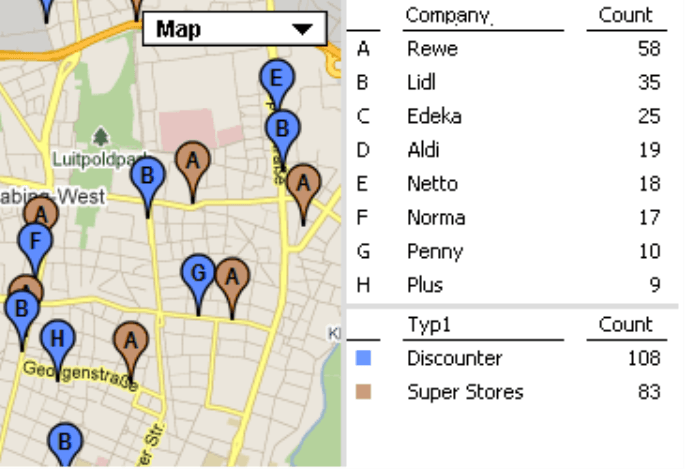
To explain how this module works, we have created a small application which you can see on the previous page. Here, we have gathered and processed the addresses of 191 supermarkets in the greater Munich metropolitan area. We will explain this process briefly later on.
Before you can start to experiment with the Location Analysis module in DeltaMaster, you must first activate the module. In order to use Google’s services, you must also approve a separate usage agreement. You will find some general notes on licensing and activation in the sections below. Please contact your DeltaMaster partner or account manager, however, for complete information.
DeltaMaster deltas! 5.4.6 also contains a thorough documentation for using Location Analysis. Here, we will focus on the most important usage scenarios and settings.
Getting the data
You can use Location Analysis with OLAP analysis models as well as relational models (i.e. without OLAP cubes, see DeltaMaster clicks! 04/2010 for more information). For the sake of simplicity, we have based our example application on a relational one and have simply placed the addresses in an Excel spreadsheet. In order to create an analysis, however, DeltaMaster will need to know the latitude and longitude – and not just the address – of each location. As a result, you will need to generate these coordinates (e.g. using Google) before you can begin. Although geocoding is not part of the Location Analysis module in DeltaMaster, we would be happy to support your with our own methods and tools. You can also obtain geographic coordinates in the master data of many CRM, logistics, or other operational systems.
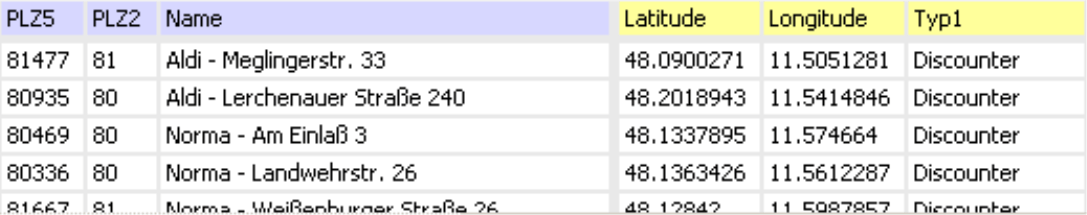
DeltaMaster directly accesses the Excel table containing the addresses and geographical coordinates (ImportWizard or TableWizard). In this case, we have modeled the stores as a separate dimension and have included the latitude and longitude as member properties. In the relational sample model on your right, these are the fields with the yellow column headers. The zip codes (PLZ5) and zip code areas (PLZ2) are not mandatory for a Location Analysis; we have simply added the columns to create an additional dimension which we can later use as a filter.
Location Analysis: Settings
Now you have the data you need. Before you can start your analysis, however, DeltaMaster needs to know which dimension contains the objects that it should display, as well as where the coordinates are located.
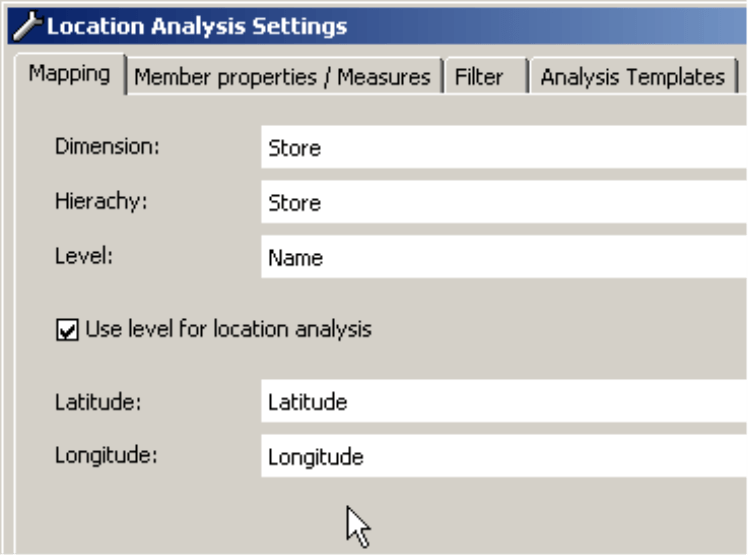
Go to the Properties of the Location Analysis on the Mapping tab and select the Dimension, Hierarchy, and Level that you would like to Use for Location Analysis. DeltaMaster will then show their member properties in two drop-down lists from which you can select the Latitude and Longitude. These settings will then apply to all location analyses in the current analysis file.
That’s all you need for the general configuration. DeltaMaster can now place flags in Google Maps.
Filtering locations in the View window
Just as in other cockpits, reports, and analytic methods, DeltaMaster will display the selected objects in the View window. For the dimension ‘Area’ as shown in the example on your right, we have selected ‘81’ which includes the regions West, South, and East of Munich. Accordingly, the map will only display the stores that are located in this region.
In Miner mode, you can now double click on a flag or marker to take over the respective object into the View using DeltaMaster’s threaded analysis technology. In this case, the Location Analysis serves as a starting point, for example, so that you can identify a particular customer that you would like to examine in further analyses and cockpits (e.g. as part of a customer ‘cheat sheet’ or a scorecard).
Points of view
Most of you probably don’t need a long explanation on how to navigate Google Maps. In DeltaMaster, you can use the same familiar features – for example, drag and drop to move the map section; the wheel of your mouse or the displayed navigation elements to zoom. Beyond that, you can also access additional options from the context menu or the I want to… menu.
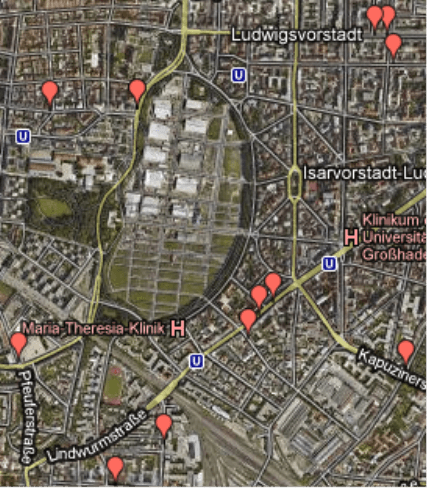
You can switch among the different Map types – Map, Satellite, Hybrid, and Terrain in all user levels from Reader to Miner.
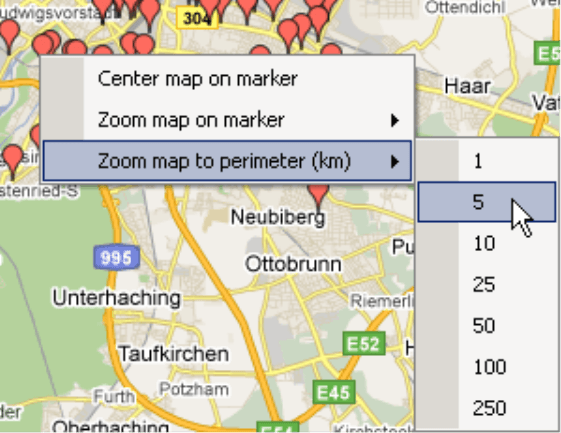
Using the context menu, you can Center [the] map on [the] marker so that you can see the currently selected member; the zoom level adjusts automatically. The context menu also contains two special functions for each individual object. You can Zoom in on the selected flag to the desired level of detail and place it in the center of your map. To increase the level of detail, choose a higher level; 0 for example, shows a global map, while 21 shows a few buildings. Alternatively, you can configure the map to show a given radius (in kilometers or miles). This is very helpful, for example, if you want to examine the region around a certain store.
As in most other analytical methods, you can select combined visualizations from the View menu. The table will then display all member properties and measures that you have selected in the Properties. This will be explained in detail in the section below.
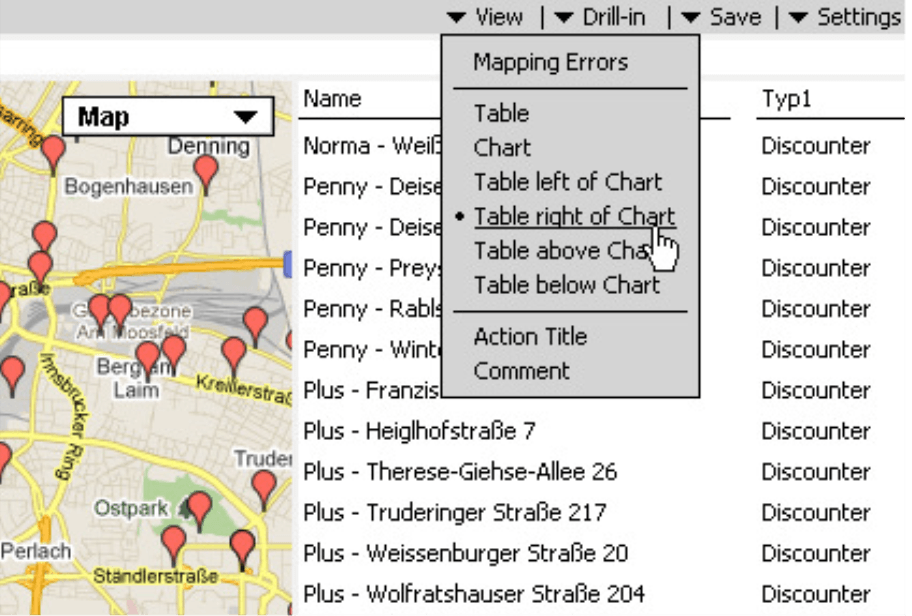
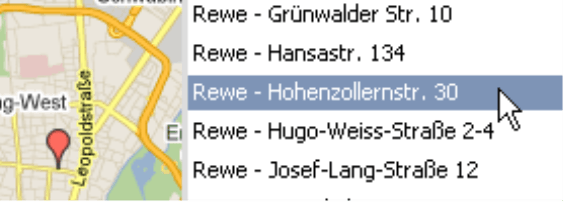
The map is synchronized with the table. If you use your mouse to point to a row, you will only see that particular flag in the map. DeltaMaster will hide the other flags.
You can also detect potential Mapping errors in the View window. These are objects that could not be positioned on the map – in most cases, because the latitude and longitude data is either missing or incorrect. You can use the various functions described above in many different scenarios.
Now, you are ready to visualize the actual geographical locations in Google Maps. For DeltaMaster, however, the actual analysis is just the beginning. In particular, the following two functions can dramatically increase the amount of insight that you gain from this visualization:
- You can use different flags or markers to categorize the locations.
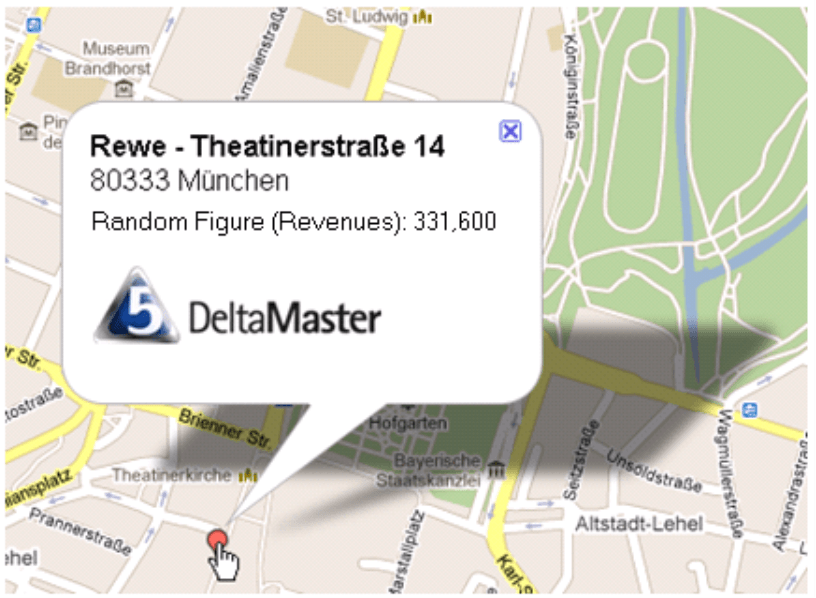
- You can show additional information for each location in a either a tooltip or an HTML balloon. This means that you can integrate various business measures from your data model into the visualizations.
Users in all modes from Reader to Miner can customize these options under Properties (context menu, I want to… menu).
Customize the flags to show categories
The flags in your map, however, do not need to be identical. Since DeltaMaster can apply different symbols to different members based on the underlying data, you can assign them to categories in order to show relationships. In addition to differentiating customer types or grouping them by industries, you could also use this function to differentiate your stores from competitor stores or distinguish the private or commercial usage of real estate.
DeltaMaster uses member properties to categorize and allocate symbols. In our example, we will categorize our stores as discount supermarkets and superstores. Respectively, we have defined “Typ1” and “Company1” as member properties and filled them with information regarding the store type and supermarket chain.
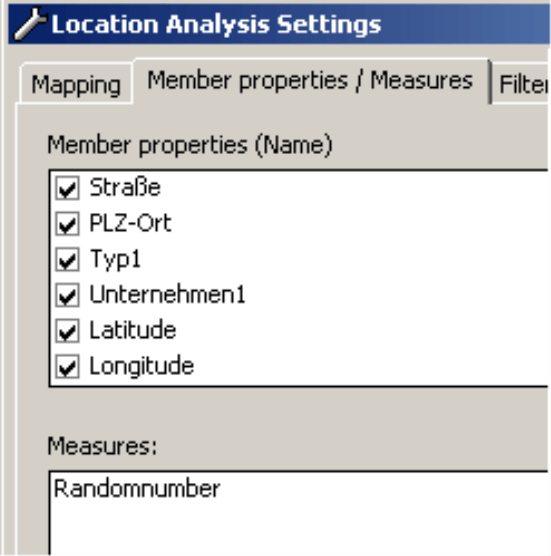
You can define which member properties you want to use for categorizations (or display in tooltips or HTML balloons) in Miner mode under the Settings of the Location Analysis on the Member properties/Measures tab. You can later access the members (and measures) that you select here in the Properties dialog box. DeltaMaster uses this approach because of its different user levels. While you can only edit the Settings in Miner mode, you can change the Properties in all user levels from Reader to Miner. If you are working in Miner mode, therefore, you can define which member properties users can access on the other levels. This is very helpful, for example, if you want to simply a complex data model.
You can define the appearance of the markers in the Properties of the Location Analysis (context menu, I want to… menu). On the Marker tab, you can define the Shape/Content as well as the Background color.
Let’s start with the Shape/Content tab. If you select a Custom marker, DeltaMaster will use the same flag for all objects. The same applies if you choose a Standard marker, which comes in your choice of two sizes. If you want to categorize your data By member property, you will need to select this option as well as the desired property.
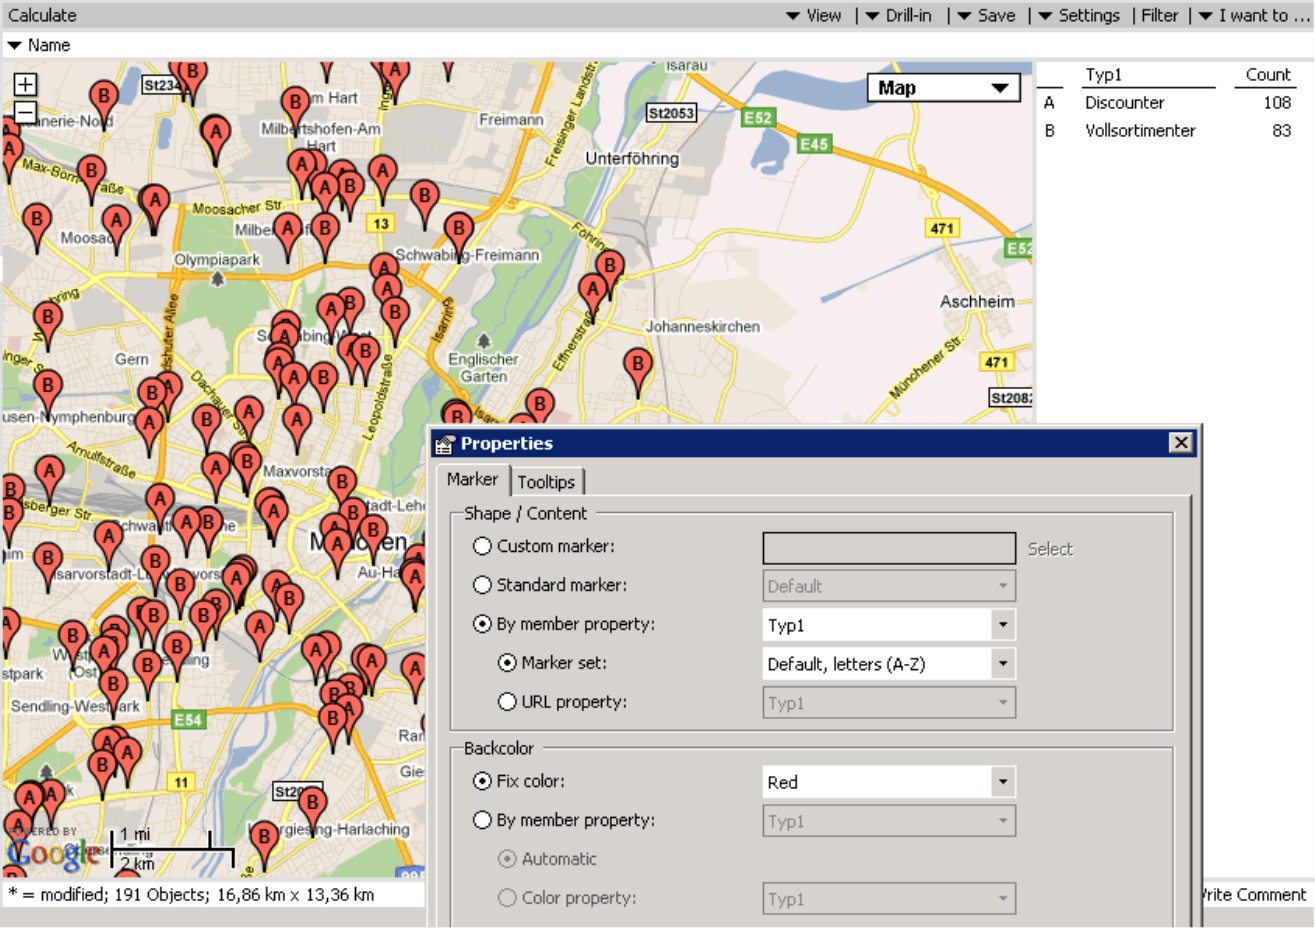
In our example, we have selected ‘Typ1’ (e.g. superstores or discounters) as the member property. If you choose a marker that dynamically adjusts by member properties, you will have to choose from two alternatives:
- For standard sets (Letters A-Z and Numbers 0-99), DeltaMaster counts how many members have this attribute for each member property. It then categorizes the largest group in terms of numbers with an ‘A’ (i.e. 108 discounters), the second largest with a ‘B’ (i.e. 83 superstores), and so on. You can view the location of each symbol and type as well as the respective number of members in a Legend, which you can show or hide using the context menu or I want to… menu. This legend is also synchronized with the map. If you mouse over an entry, therefore, DeltaMaster will only display the objects in that group, for example, all superstores.
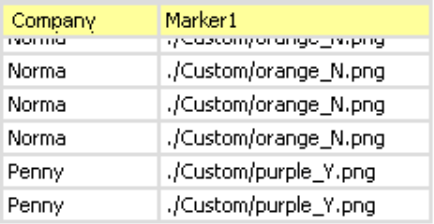
- A very clever way to manage the symbols is to use the URL property, a member property which states exactly which image DeltaMaster should display. This URL can link to a file in a file system (path/file name or relative file name from the ‘Markers’ folder, see below) or an image on an Internet or Intranet server.
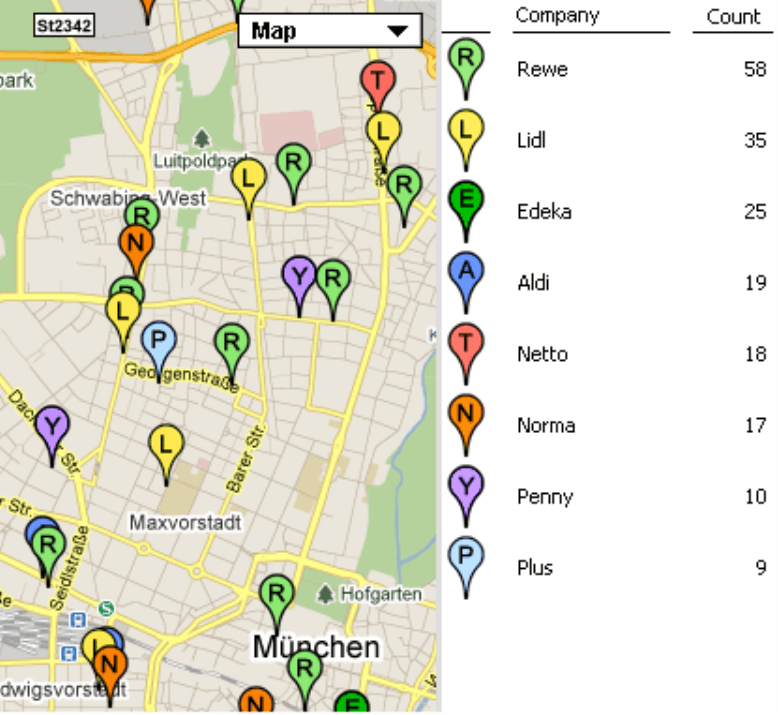
In our example, we have set markers with the first letter (or another prominent letter in case the first one isn’t clear) of different store chains as the member property. These images come from DeltaMaster’s standard collection of symbols; we have simply saved them in a separate folder.
DeltaMaster comes with a small library of different collections of symbols, which you can also combine to create a customized set. DeltaMaster automatically selects the symbols that are defined in the properties. These standard symbols are located in the ‘resMarkers’ subfolder of the DeltaMaster installation directory (e.g. C:Program filesDeltaMaster 5.4.6resMarkers).
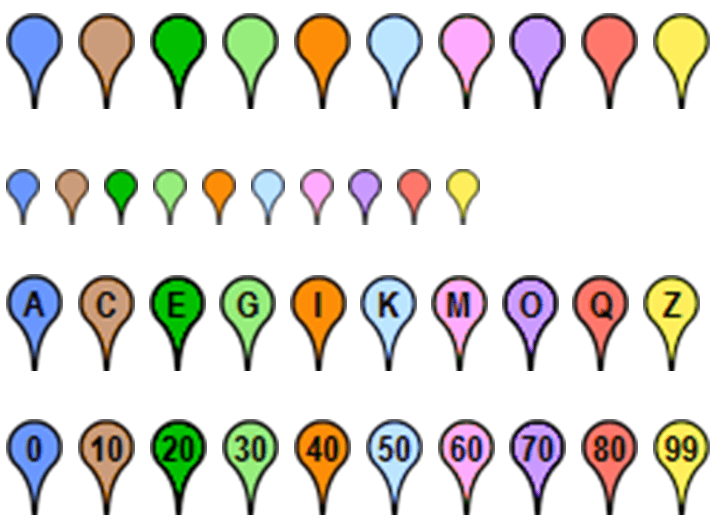
If you use standard or dynamic flags (i.e. change based on the member properties) from these standard sets, you can either select a Fixed background color of your choice or a Color property which links it to a member property in the Settings. The default symbols are available in the colors shown above.
This gives you a wide selection of different symbols and colors to categorize your objects in various ways. If these options still don’t suffice, you can also use your own image files (preferably in PNG or GIF formats which both support transparency) by entering them as a URL property.
You can apply colors and symbols at the same time to differentiate objects using two attributes. In the map on your right, the automatically allocated letters of the standard flag set show the store chains while the automatically selected colors show the type of store (e.g. super stores or discounters).
Additional information in tooltips and HTML balloons
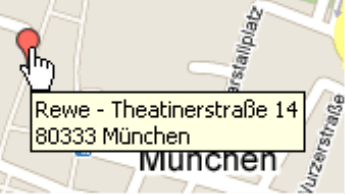
In the Properties (context menu, I want to… menu), you can also manage which information DeltaMaster should display as a Tooltip or an HTML balloon when a user points to an object with his mouse. This function enables a deep integration with your analysis model because you can display all of the ‘activated’ member properties and measures (see section above for more information).
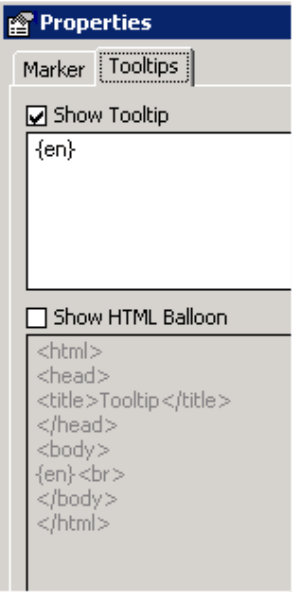
For example, DeltaMaster would replace the variable ‘{en}’ with the respective name of member.
While you can only display unformatted text in a tooltip, you can individually format the output and embed images or other external elements in an HTML balloon. Since DeltaMaster interprets the text in the entry field as HTML code, you can leverage the full functionality of HTML.
Using the analyses
As in every other analysis, a user in Miner Expert mode can save and publish a Location Analysis as a report in a Briefing book where other users working in Reader, Viewer, Pivotizer, or Analyzer mode can access it. Once you have saved a Location Analysis as an analysis template, you can integrate it into combination cockpits.
When you export a Location Analysis to Microsoft Word or PowerPoint, it will be entered into the document as a screenshot image. Since this image will not include any tooltips or HTML balloons, you may wish to switch to a combined View so that you can also examine the locations in a table. When you export to Microsoft Excel, DeltaMaster will only transfer the data that is displayed in the table view of the analysis. If you export the analysis to an HTML e-mail, the map will only be a static image. In this case, however, tooltips will be exported with the image whereas HTML balloons will not. You can also use DeltaMaster ReportServer to automatically export the analysis.
Licensing and legal agreement
You have probably already used Google Maps quite frequently for free. The integration of Google Maps into DeltaMaster, however, is a charged service that is bound to a legal agreement. To use the interface to Google Maps, you will need to purchase a license from Google. Some companies already use Google Maps in combination with other applications and may already have a Google Maps API Premier Key. If you company does, you can use this license for DeltaMaster as well. Please contact us for more information on how you can leverage this license. DeltaMaster customers that don’t already have their own Google Maps API Premier Key can either purchase one or use a license through a proxy server which we have purchased especially for this reason. This server retrieves the desired map files from Google Maps. The terms of usage with respect to Bissantz & Company and Google Inc. are combined in a separate usage agreement.
The licensing in DeltaMaster is simple. To create a Location Analysis, you will need a Miner Expert license; alternatively, you can also purchase a separate add-on license for Miner Professional. You can save and publish Location Analysis reports to a briefing book, from where users can access them in Reader, Viewer, Pivotizer, or Analyzer mode. In Miner Professional mode, you can only create a Location Analysis with a separate license. In Miner Expert mode, you can always see Location Analysis; you can only use it, however, if the licensing for Google Maps has been set up. Otherwise, DeltaMaster will display a message how you can activate this module.
![]()
A valid Google Maps license and an Internet connection are necessary in any case.
Summary
Through its integration into Google Maps, the Location Analysis in DeltaMaster offers many fascinating possibilities to bring Business Intelligence closer to the venues where they are happening. What’s more, you can expand the analysis beyond business measures to include operational factors. The characteristics of this module include:
- Integrated Google Maps as an analysis or report
- Dynamic placement of flags based on the member selection in the View window
- Threaded analysis (Miner level): If you double-click on a flag, DeltaMaster will take over that object into the View. As a result, you can immediate embark on further analysis directly from the map view.
- Option to use custom symbols instead of standard Google flags
- Data-driven flag design: You can link symbols and colors to the member properties in order to visualize the category relationships or other characteristics (e.g. company vs. competitor stores)
- Display of object-specific data (e.g. business KPIs in a sales analysis application) from the analysis model in regular or HTML balloon tooltips
- Synchronized map and table views: When you mouse over an entry in the table, DeltaMaster will highlight the respective flag on the map.
- Interactive legends: If you use your mouse to point on a category in the legend, DeltaMaster will highlight all of the flags in that category without changing the view.
- Option to export the map views including flags as a Microsoft Office file, PDF, or HTML e-mail
- Automated report export with DeltaMaster ReportServer
- Support for OLAP and relational models (e.g. Excel files or Access databases)
- Report creation in Miner Expert mode (also accessible in Reader, Viewer, Pivotizer, and Analyzer modes)
If you want to experience Location Analysis live in action, simply contact your DeltaMaster account manager.
Questions? Comments?
Just contact your Bissantz team for more information.
