![]()
Greetings, fellow data analysts!
It’s amazing how quickly (and frequently) young people type text messages on their mobile phones. Nowadays, you don’t even need to press any buttons. If you have a handheld, smartphone, or tablet, you simply need to wipe or touch the screen to tell the computer what you want to communicate with someone else. This works on account of the devices’ technical capabilities but also because you hold them in your hand. After all, it is not always easy to teach your fingers to perform abstract operations.
DeltaMaster also has some subtle shortcuts to simplify and accelerate common tasks. These include mouse commands in combination with control keys. Although they aren’t as obvious as the commands and options located in the menus and dialog boxes, these shortcuts do make things easier for experienced users. This edition of DeltaMaster clicks! will share a few helpful commands for working with pivot tables. No doubt, your colleagues will soon be looking at your nimble fingers with amazement.
Best regards,
Your Bissantz & Company Team
Time and time again, we notice how new DeltaMaster users are amazed by how quickly their experienced colleagues can create and edit pivot tables. With a few movements here and a few clicks there, they skillfully adapt the table structure to their needs. One of the reasons for this smooth usability is that you can change many aspects of a pivot table using mouse commands within the table, in other words, without having to open an additional dialog box. Plus, you can extend the command options of your mouse simply by pressing the Ctrl or Shift key.
When you are creating a pivot table, you generally have to perform three basic tasks: place the desired dimensions (i.e. characteristics) in the pivot table, determine how you want to sort the members within each dimension, and set the desired level of detail, for example, by expanding or collapsing the branches based on your information needs.
This time, the art of visualizing and analyzing data will take a back seat. So roll up your sleeves and get ready to use your hands.
Adding, sorting, and removing dimensions from a pivot table
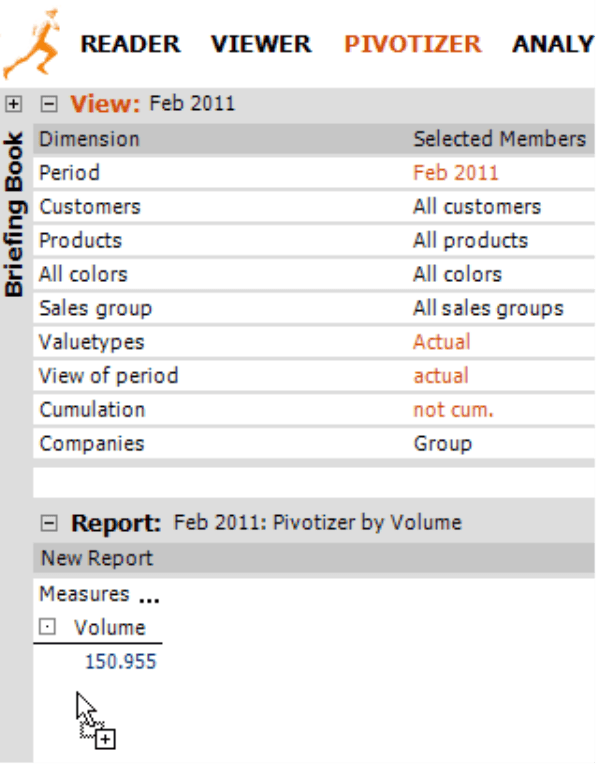
You can edit and create new pivot tables in Pivotizer, Analyzer, and Miner modes. You are probably already well versed in the first steps. To add a dimension to a report, you simply drag it from the View window into the window containing the pivot table. (This window is called Report in Pivotizer mode, Analysis in Analyser mode, and Cockpit in Miner mode. In the following explanations, we will assume that you are working in Pivotizer mode unless otherwise stated.) From here, you can drag the name of the dimensions (left column in the View window), the displayed name of the hierarchy (optional middle column), or the selected member (right column) with your mouse.
DeltaMaster takes note where you drop the dimension and automatically places it on either the row or column axis.
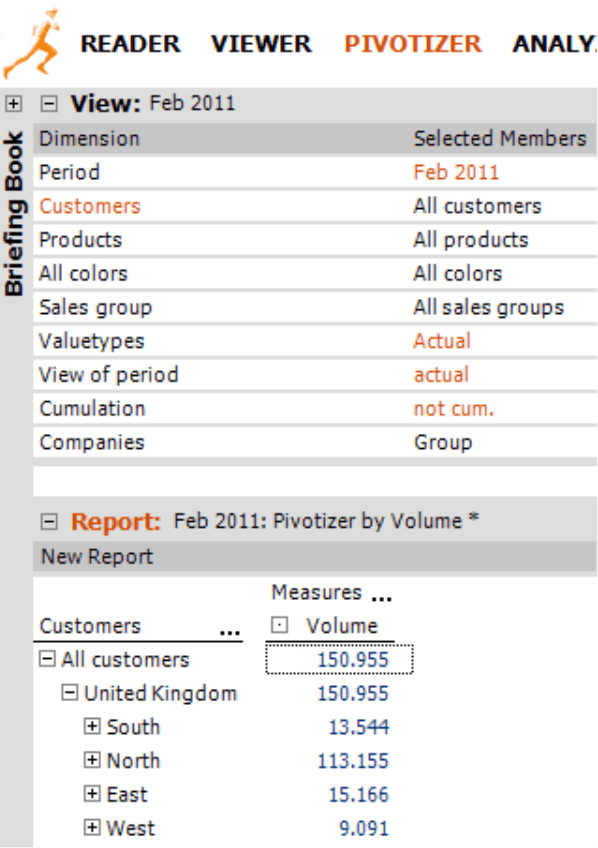
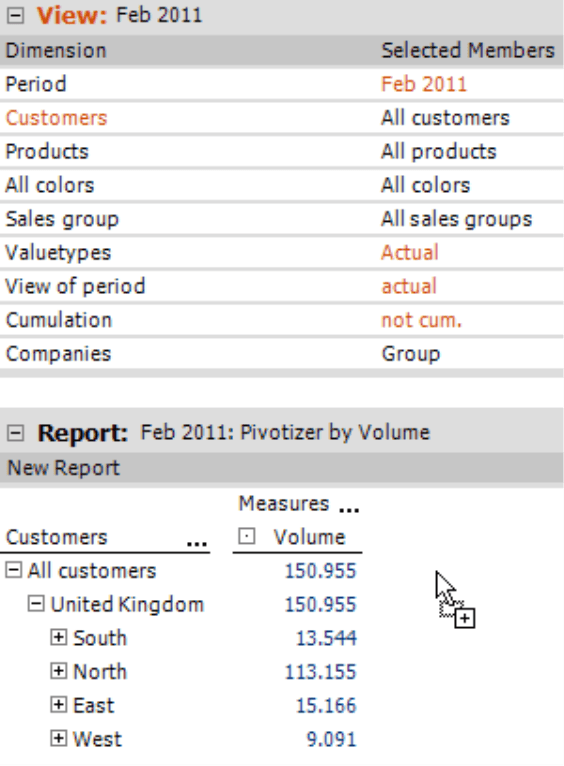
If you drop the dimension below the existing table, DeltaMaster will place it on the row axis. This also applies when you drop the new dimension on another dimension of the row axis. Once you release the mouse button, the dimension will first be rolled up. In the screenshot on your right, we have drilled down to display two levels of the customer dimension.
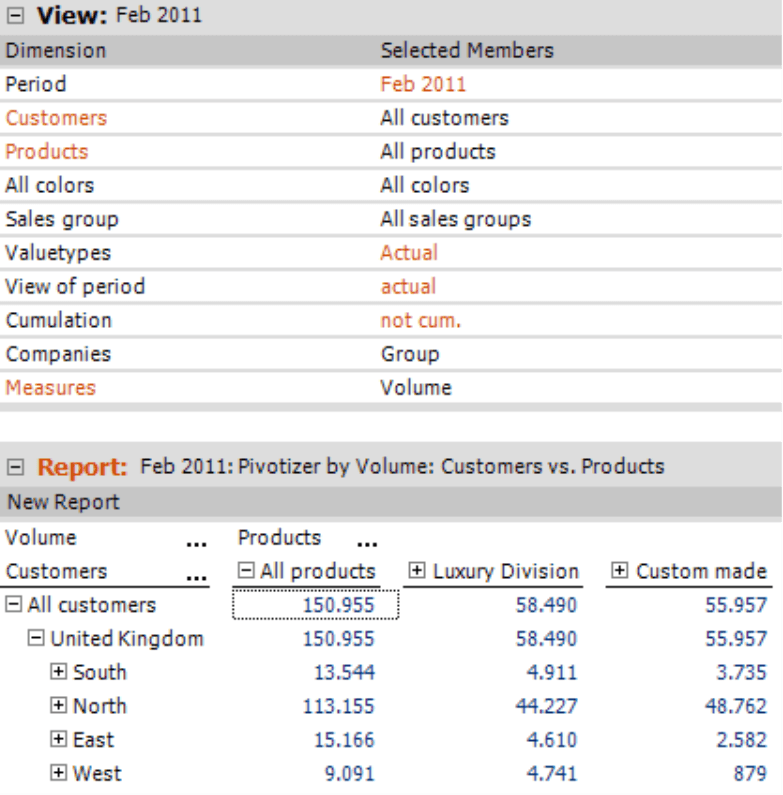
If you drop the dimension next to the existing table, DeltaMaster will place it on the column axis. This also applies if you drop the new dimension on another dimension of the column axis. In the screenshot on your right, we have drilled down to the first level of the product dimension and have dragged the measures into the upper-left part of the table to save space.
DeltaMaster has removed the ‘Measures’ label automatically.
You can also use drag and drop to rearrange the existing axes within the pivot table. DeltaMaster will insert the axis that you are dragging into the row or column structure.
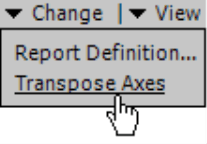
If you want to completely switch the rows with the columns, you don’t need to reorganize all of the dimensions by hand. In this case, simply use the Transpose axes command in the context menu or I want to… menu.
To remove a dimension from the report, simply drag and drop it back into the View window. This returns it to the place where you originally took it. To use the drag and drop function here, you can once again either select the hierarchy names or simply grab a specific member.
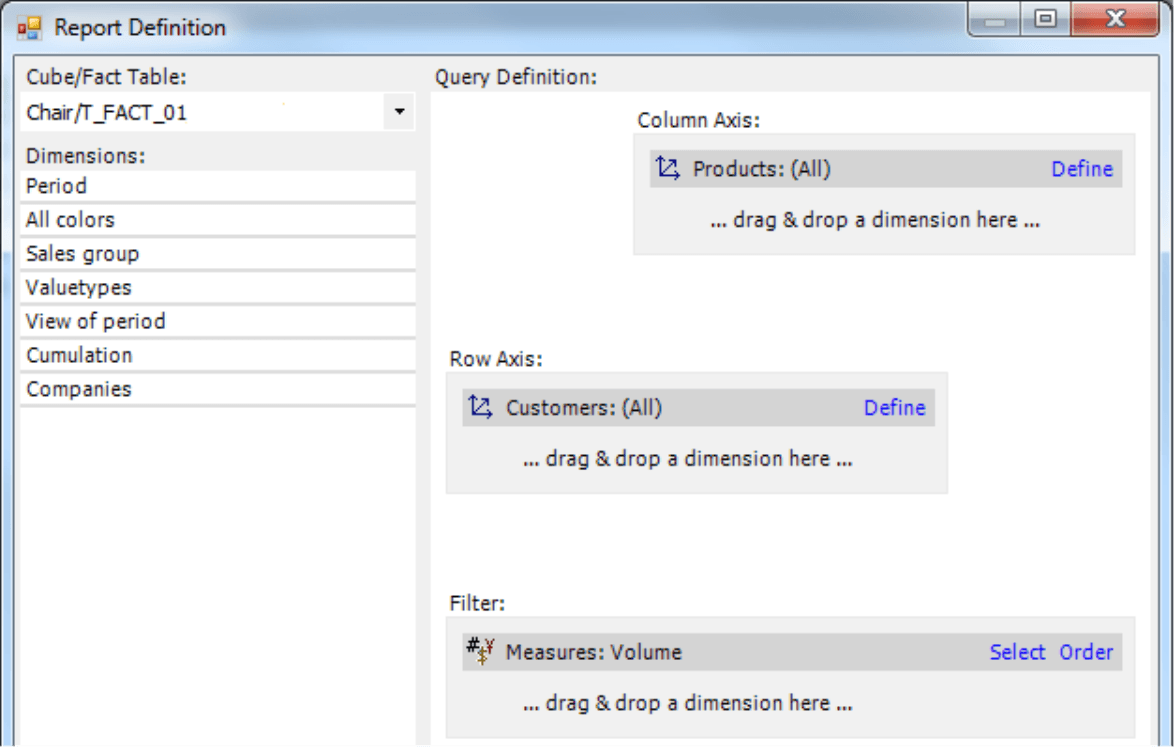
Alternatively, you can edit the structure of the table at any time in the Report definition (Change menu in the Report window). Using the mouse to move objects directly into or within the report saves time. You can, however, perform any of these operations in dialog boxes as well.
The Report definition is especially helpful if you want to make several changes at once without having to wait for the table to be recalculated. Even in applications with multiple dimensions, it is sometimes easier to create a structure from a bird’s eye view without having to use all detailed member names and values as you would if you were working directly in the pivot table.
Arranging members within their dimension
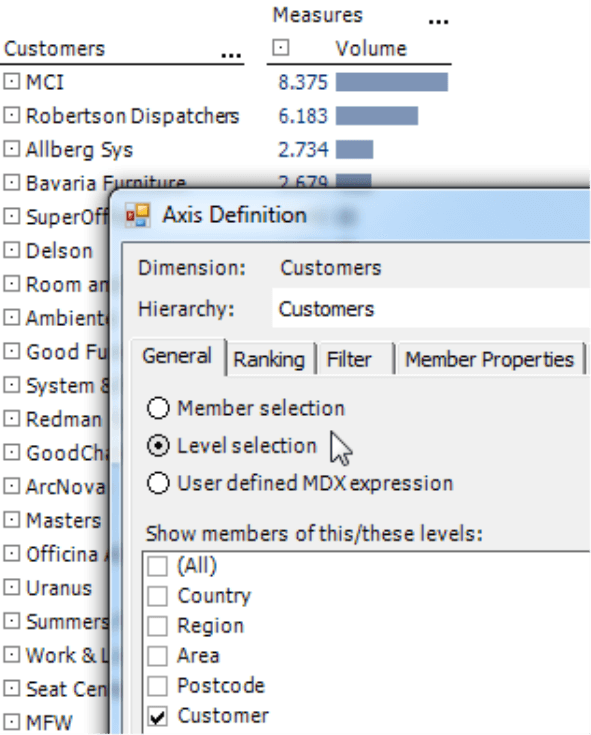
In some reports, the order of the members within the dimension depends on certain analysis functions, for example, a ranking. In a sales analysis, for instance, you might want to sort the customers based on their revenues from highest to lowest and not by their names in the same order as always. In cases like this, open the Axis definition to the General tab and either choose a Level selection or a user-defined MDX expression. The system or the results of the MDX expression – taking into account the Ranking (tab in the Axis definition) or other options – will then determine the members’ final order. In both of these cases, you cannot sort the members manually.
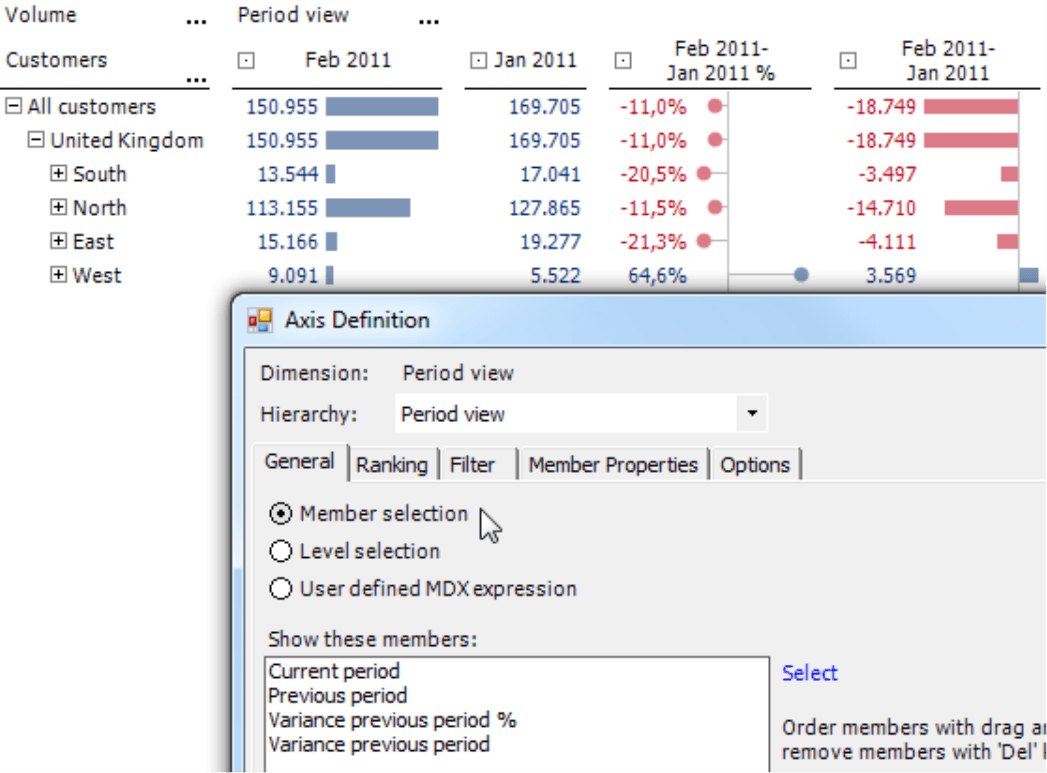
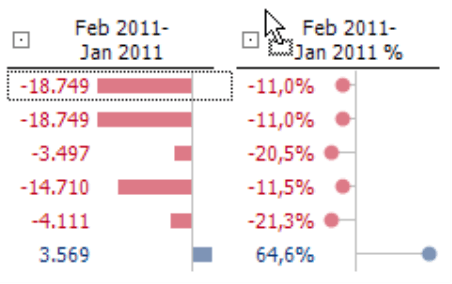
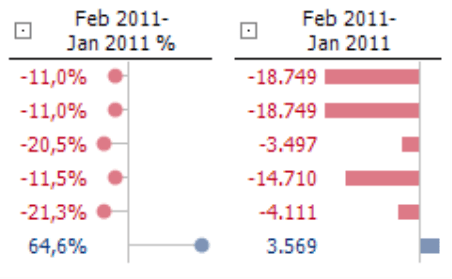
In other reports, you may need a constant order in the rows or columns. This is often the case when you are dealing with different scenarios (e.g. actuals, budget, budget-actual variance) or different time periods (e.g. current, previous period, same period last year, variances). Here, DeltaMaster should always display the report objects in the same order regardless of sorting rules or the values’ size. If you want to define a constant row or column structure, open the Axis definition, select the General tab, and choose the Member selection option. In this case, you can Select which members you want to display and in which order (i.e. same as in the list field). To change the order of the members, simply drag and drop them within the list field.
In a Member selection, you can also arrange the dimension members directly in the pivot table by pressing and holding the Alt or Ctrl key while you drag and drop them. In this case, DeltaMaster will insert the dragged member into the column or row in which you have dropped it and the others will be moved either down or to the right. Using this technique, you can modify a pivot table very quickly without having to open the Axis definition. Please note that DeltaMaster will recalculate the database query each time you move something. If you want to reposition several members in a large table, therefore, it is probably easier to make these changes in the Axis definition. Here, you can make your changes in their entirety first, and DeltaMaster will run the query only once when you are finished.
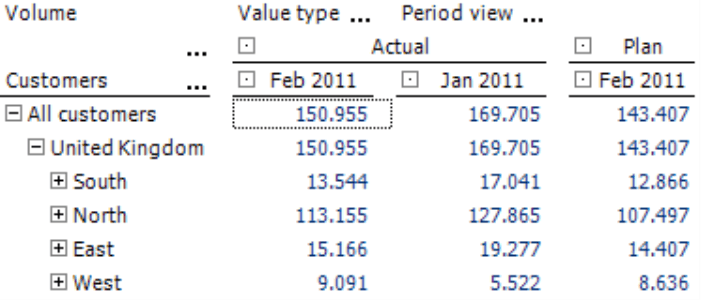
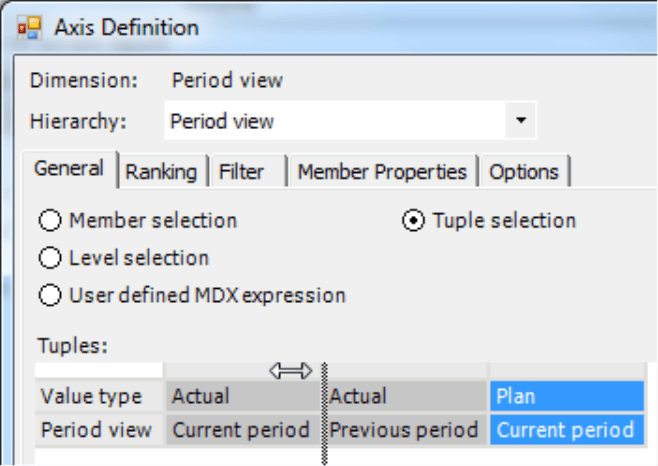
As soon as you place more than one dimension, e.g. value types (‘Actuals’ and ‘Budget’) and period views (‘Current period’ and ‘Previous period’) on an axis, you will be able to choose a Tuple selection, the fourth selection type in the Axis definition. For more information about this feature and the tuple editor, please refer to DeltaMaster clicks! 01/2009. In tuple definitions, you can combine one member from a dimension with exactly one member from another one.
Using tuples, therefore, you can create combinations such as ‘Actuals’ and ‘Current period’, ‘Actuals’ and ‘Previous period’, or ‘Budget’ and ‘Current period’. In most cases, you won’t need the fourth possible combination ‘Budget’ and ‘Previous period’. Hiding irrelevant combinations is one of the main reasons for using the tuple editor. The easiest approach is to choose the tuples in the order that is offered in the table structure preview of the tuple (Axis definition, General tab). From here, you can move them by dragging the small gray area before or above the member name and dropping it in the desired place. Theoretically, you could also change the order directly in the pivot table by pressing the Alt key while you drag and drop. This only works, however, when each member only appears once. Since this rarely happens, however, you will almost always need to use the tuple editor in the Axis definition.
Let’s recap: When you perform a Member selection, you can either arrange the members directly in the report by holding the Alt or Ctrl key while you drag and drop them or by using the Axis definition. If you want to use a Tuple selection, the best option is to arrange the members using the tuple editor in the Axis definition. If you choose a Level selection or user-defined MDX expression, the data will determine the members’ order and you will not be able to adjust it manually.
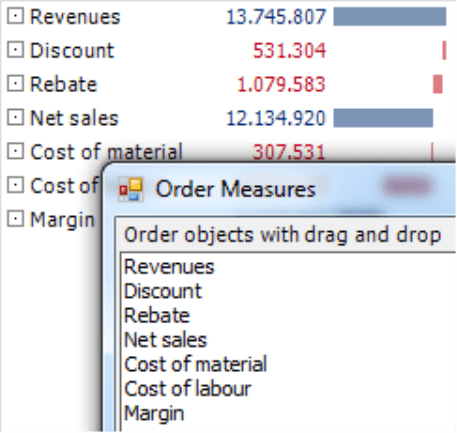
Arranging measures
As far as usability is concerned, the axes containing measures react very similarly to a Member selection. You simply arrange the order by holding the Alt or Ctrl key while dragging and dropping them. In addition, you can also use the context menu of this axis to Arrange measures. This opens a small window where you can move them to the desired Location.
Editing the member selection within a Report
In the context menu of the dimension member, you can choose from three options to change the member selection in this dimension without leaving the report: Drill across, Keep <member>, and Slice <member>.
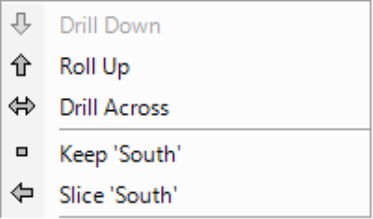
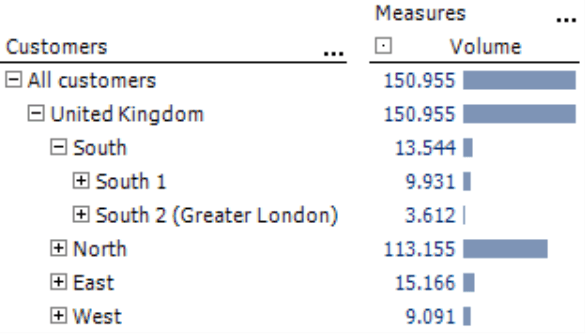
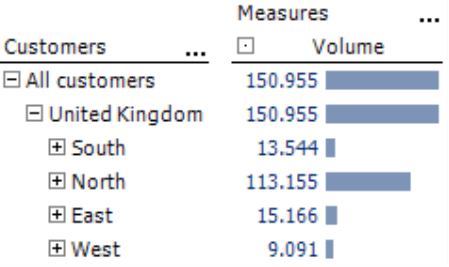
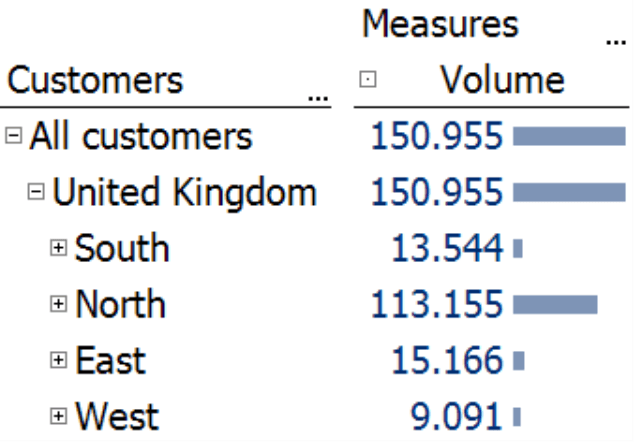
You can see the effects of these commands in the example on your right. Let’s start with a small pivot table showing the number of units sold for the entire market (i.e. ‘All customers’), the United Kingdom, and its four sales regions. The ‘South’ region is also broken down into ‘South 1’ and ‘South 2 (Greater London)’.
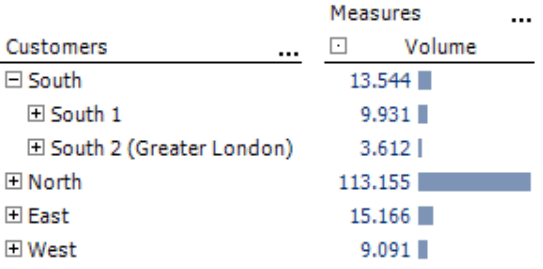
If you Drill across on ‘South’, DeltaMaster will reduce the chart so that you can only see the level of the selected member (i.e. ‘South’ ). In this case, the report will only show the sales regions including the subordinate ones below ‘South’, which you could see before as well. The total market and the country, however, have been removed.
If you choose to Keep the selected member, DeltaMaster will reduce the chart even further and will only select the desired member on the respective level. This option also affects the selection type in the Axis definition and transforms a Level selection, a User-defined MDX expression, or a Tuple selection into a Member selection.
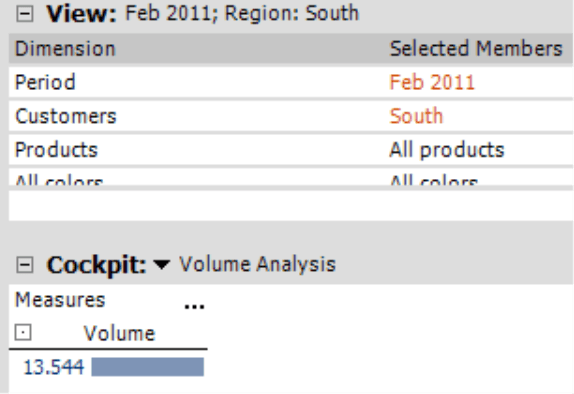
The Slice option also changes the focus of the report in the View – not through the selection in the Axis definition. In this case, DeltaMaster will show the member which you used to slice the cube in the View window and remove the respective dimension from the pivot table. This makes the pivot table even smaller.
Drilling down to expand branches in the pivot table
For many users, expanding and collapsing branches is one of the best functions of pivot tables. After all, you can quickly and spontaneously determine how much detail the report should contain or not. As you already know, you can expand a branch with a simple mouse click on the plus sign of a pivot table, or collapse it by clicking the minus sign. This works for a single branch. If you hold the Shift key while clicking the plus or minus sign, you will either open or close the entire hierarchy level. In other words, DeltaMaster will drill down or roll up all of the members on the same level.
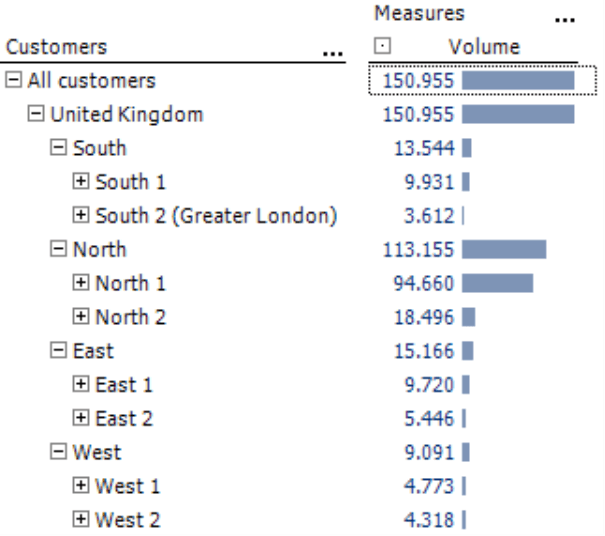
The screenshot on your right shows a simple pivot table containing the customer dimension with the total market (i.e. ’All customers’), one country (i.e. ‘United States’), and its four sales regions (i.e. ‘South’, ‘North’, ‘Ost’ and ‘West’).
With a Shift + click on the ‘+’ before ‘South’, DeltaMaster will open all of the nodes on the region level and not the children of this member. In other words, you can expand the table in four different places at once with just a single click.
If you want to hide the region level (e.g. ‘North 1’, ‘North 2’) again, simply hold the Shift key on a ‘–‘ sign before one of the region members (i.e. ‘North’, ‘East, ‘South’, ‘West’). DeltaMaster will then roll up these nodes and hide their children so that the chart looks as it did when you started (see screenshot above).
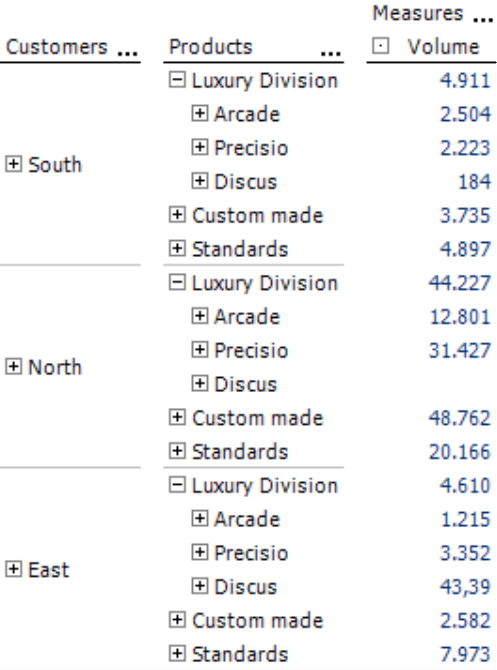
If you are using nested axes, you can also use a further option. When you drill down on a member in this case, DeltaMaster will display the children of that member in all rows containing that member. Take a look at the screenshot on your right. When you drill down on the product category ‘Luxury division’, DeltaMaster will display the subcategories ‘Arcade’, ‘Precisio’, and ‘Discus’ across all customer regions.
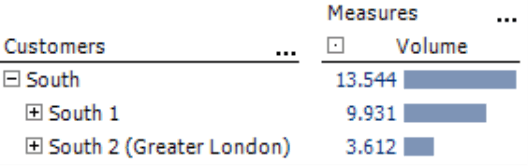
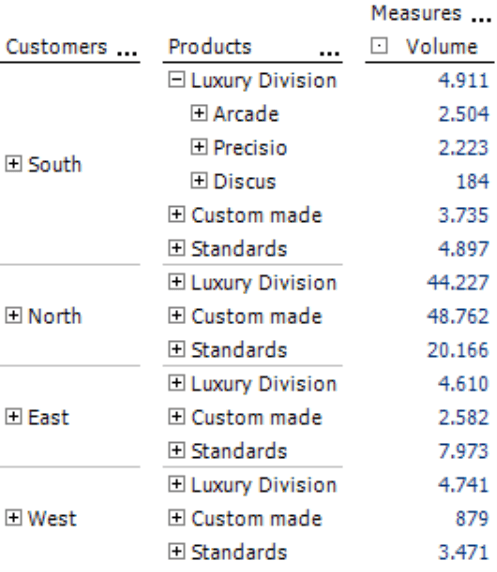
Sometimes, however, you only want to show more information for a single row and not all of them. You can do this by using the Ctrl key. If you hold the Ctrl key, DeltaMaster will only drill down on the current row. In the screenshot on your right, therefore, it will only display the three subcategories for the row ‘South’.
The Shift + click and Ctrl + click features explained in this section also work in Viewer mode.
Zooming in and out on pivot tables
Although the following tip has nothing to do with the structure of a pivot table, it does affect its appearance and every control function or mouse trick that makes working with DeltaMaster seem so effortless.
If you hold the Ctrl key and move the wheel of your mouse, DeltaMaster will zoom in or out on the table. This feature works in all user levels as well as in presentation mode so that you can adapt the screen display instantly if your audience wants to see a larger font size and the amount of data allows for it. You can also zoom in and out on your data using your keyboard: Ctrl + Plus and Ctrl + Minus.
Sorting values
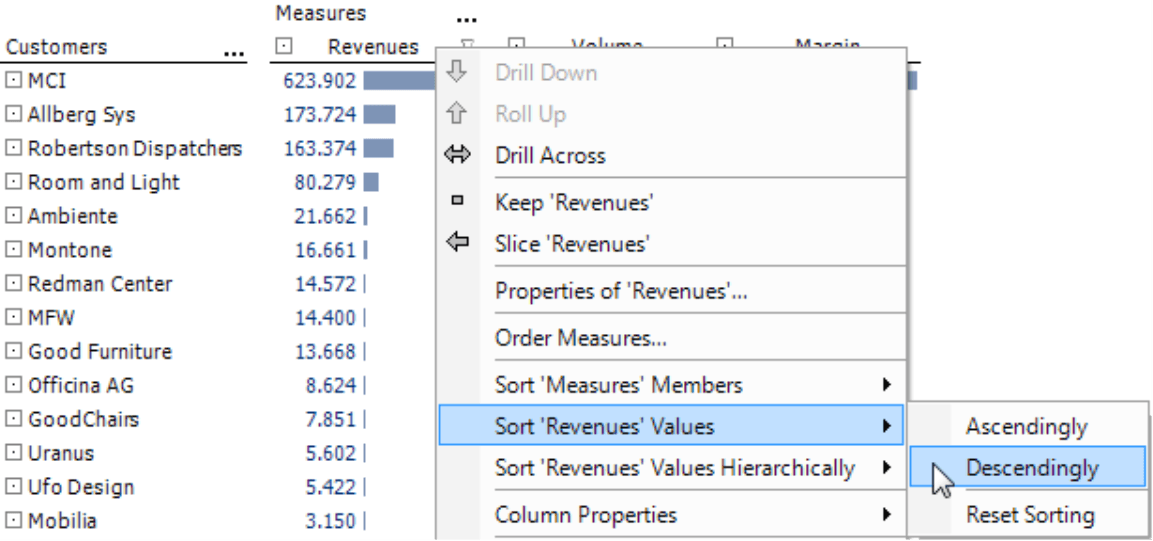
When you are working in pivot tables with multiple measures or comparing different scenarios, you may wish to sort the data in a different way than you have saved the report. With DeltaMaster, you can sort your data directly from the context menu of measures and members. Here, you can choose to sort your data by members or values.
Sort members means that the members will be arranged alphabetically according to their names as you can see by the symbol ‘A-Z’ in the context menu.
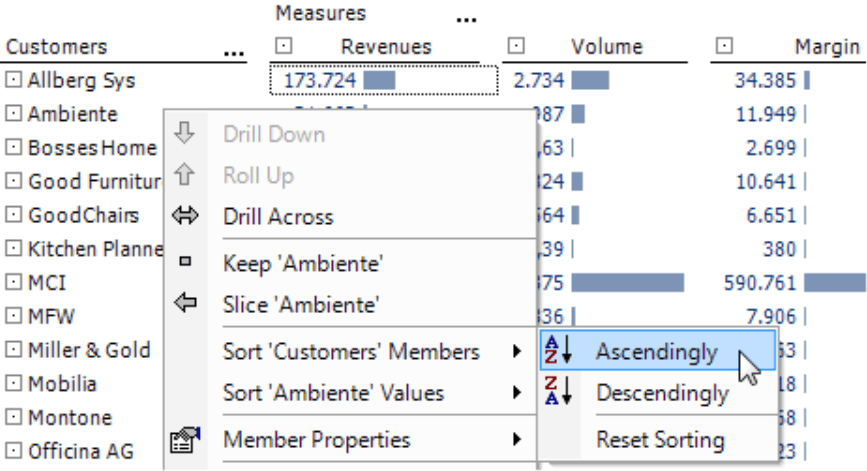
If you want to rank the table by your numbers, you need to sort the Values.
You can sort columns with measures even more quickly by simply double clicking on the column header.
Sorting your data with the context menu or a double click works in all user levels as well as in presentation mode. This option, however, is not the same as a Ranking, which is defined in the Axis definition. When you sort values using the context menu or a double click, DeltaMaster calculates the ranking based on the existing values without recalculating them from the database. As a result, this ‘superficial’ sorting option is also available in Offline Reader mode. If you want to reference the table in a Flexreport, however, the sorting should be anchored in the database query and, therefore, defined as a Ranking in the Axis definition.
Pivot tables in presentation mode
Using the shortcut Shift + F5, you can switch the current pivot table into presentation mode. If you simply hit F5 without the Shift key, the presentation will start with the first report.
Including additional values in a Ranking or PowerSearch
Users working on Miner level know that the threaded analysis technology is a very effective mechanism to thoroughly and flexibly analyze numbers in a pivot table. To do this, you simply drag the value that interests you and drop it into the desired module.
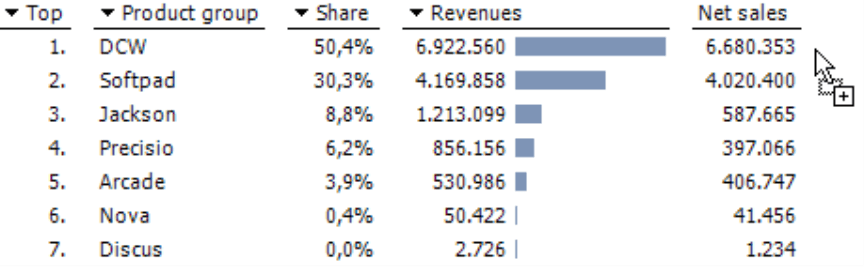
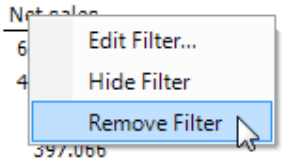
In two widely used modules, Ranking and PowerSearch, too, you can use a control key to enrich the analysis even more quickly. If you drag a measure while holding the Ctrl key and drop it into the Analysis window, DeltaMaster will display it as a separate, unsorted column in the analysis results so that you can show additional background information in these types of analyses. If you omit the Ctrl key, the value in question would then be used as a criterion to sort the data, i.e. replace the measure used before. If you wish to hide these columns, simply open the context menu of the column header and select the Remove filter command.
Summary
The following list summarizes the most important mouse commands and shortcuts for working with pivot tables.
| Drag and drop dimensions from View to Report/Analysis/Cockpit |
Add dimensions to the pivot table |
| Drag and drop dimensions from Report/Analysis/Cockpit to View |
Remove dimensions from the pivot table |
| Drag and drop dimensions within Report/Analysis/Cockpit |
Arrange dimensions on the row and column axis |
| Alt or Ctrl + drag and drop | Arrange members of a member selection and measures |
| Ctrl + click on ‘+’/’–‘ before member | Drill down / roll up for individual rows within nested axes |
| Shift + click on ‘+’/’–‘ before member | Expand or collapse hierarchy level completely |
| Alt + right click on a measure | Change Business Intelligence factor (as in Member properties) |
| Double click on a measure on an axis | Sort |
| Shift + F5 | Show current report in presentation mode |
| Drag and drop to an Analysis | Use measure in the analytical method and calculate right away |
| Ctrl + drag and drop to an Analysis | Add measure as additional column in Ranking/PowerSearch |
| Ctrl + mouse wheel | Zoom in/out on display |
| Ctrl + Plus / Ctrl + Minus | Zoom in/out on display |
You can also access most of the functions listed here from menus or dialog boxes. The mouse commands, however, simply help you do routine tasks more quickly and effectively. In addition, you can reuse these same functions in other modules as well. ‘Alt + drag and drop’, for example, doesn’t only arrange dimension members in pivot tables; this same function also arranges dimensions in the View window. In addition to expanding all of the branches of a hierarchy level in the pivot table at once, you can also use ‘Shift + click’ to open all folders of your Briefing book, all dimension groups in the View window, all measure groups in the Measure browser, and all cockpits in the Cockpit browser. What’s more, many of these features (e.g. zooming with the wheel of your mouse) also work in Windows Explorer and other widely used programs.
Questions? Comments?
Just contact your Bissantz team for more information.
