![]()
Greetings, fellow data analysts,
Replication doesn’t exactly have the best reputation. English teachers usually mark repetitive words in red, and television viewers quickly turn the channel when they spot a rerun. But aside from these examples, repetition is actually high in demand. In addition to playing a major role in training and learning, it is also an important principle in design, rhetoric, drama, and many other artistic disciplines. Pop music and mass advertising need repetition in order to work. And yes, most TV fans will admit that they don’t watch ‘Dinner for one’ on New Year’s Eve because they want to see a surprise ending.
As data analysts, we also appreciate the value of repetition – at least in the form of small multiples, a term coined by Edward Tufte, one of the leading data visualization experts. Tufte, who considers small multiples to be the best way to visualize data, also emphasizes the importance of multiple dimensions and data density. These are fundamental characteristics of the graphical tables in DeltaMaster. So just imagine the possibilities if we combined them together. Just browse through this edition of DeltaMaster clicks! and see for yourself – unedited and for the first time.
Best regards,
Your Bissantz & Company Team
Good reports and analyses require visualizations with dense data – not decoration. As we have shown again and again in DeltaMaster clicks! and different blog articles (see blog.bissantz.com or
ask-bella.com), tables are a tried-and-tested method for presenting dense data. Graphical tables, in turn, have taken this report format to a whole new level to help readers understand their numbers even better. The bars or columns embedded in the table explain the size relationships of the values. Sparklines also add information on developments over time and place the current results in their historical context. Trend arrows (not displayed above) integrate the results in a regression analysis and show if each value’s development follows a statistical trend.
Reports become even more informative when they contain several tables instead of a single one. This increases the data density and provides the reader with new possibilities for making comparisons – and, ultimately, analyzing the data. Analyzing, after all, means comparing.
If you avoid using large charts and shrink the size of your graphical elements, you may have some room left on your screen or printouts in many report scenarios. So why not use it wisely… with small multiples? This powerful analytical method, which has been offered in DeltaMaster since November 2008, multiplies your report formats and combines them into rich reports.
We briefly described this method back in DeltaMaster clicks! 12/2008 and in slightly more detail in DeltaMaster deltas! 5.3.7, feature #1. In this edition of clicks!, we now want to focus on how you can use small multiples in combination with pivot tables, the most important and automated format for making reports. Of course, you can also use this method in combination with a Flexreport, ranking, cross-table analysis, portfolio analysis, geo analysis, or PowerSearch, but we will not go into that here in detail.
The concept of small multiples
Let’s take a moment to recap what makes small multiples so special. When designing a small multiple report, you use the same graphical design on a series of objects and eliminate the common factors in the description. The resulting report contains several similar parts, for example, multiple pivot tables (as shown above), maps, portfolio charts, or time series. Each individual report part is called a ‘multiple’ or ‘tile’ and is based on the same template (e.g. a cockpit or analysis template) that is calculated over and over for multiple measures, members, or dimensions. In IT, this type of repetition is called an iteration, which means that the data structures (e.g. an array or all members of a list) are processed in a loop. Iterations are a key concept in small multiples. DeltaMaster multiplies the template through the iteration and generates a series of individual tiles that are almost identical except for one aspect. DeltaMaster automatically calculates, formats, and arranges these multiples on the screen. In contrast to other approaches, you must use the visualization options globally – and not individually for each multiple – so that you can compare them directly.
Creating small multiples
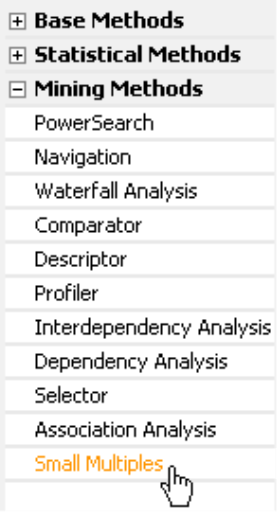
In DeltaMaster, you can only create and edit small multiples in Miner Expert mode. In the analysis menu, these are categorized under the Mining methods. If you would like to test this functionality, we would be happy to provide you with a test license. Simply contact your DeltaMaster account manager for details. Once you have created a small multiples report, of course, your readers can access it in all other DeltaMaster user levels from Offline Reader to Analyzer. You simply need Miner Expert to create and edit the report.
To create a small multiples report, you need to select three things: 1.) the desired template (e.g. a Cockpit or Analysis template), 2.) the Iteration type (i.e. what should change from tile to tile), and 3.) the group of objects that you want to calculate multiples. If you would like more information on how to use small multiples in general, please refer to DeltaMaster clicks! 12/2008. This edition of clicks! will focus on using cockpits – more specifically, pivot tables – as a template.
In the following sections, you will see how the five different iteration types affect a pivot table.
Iteration type ‘level’ (template with static axes)
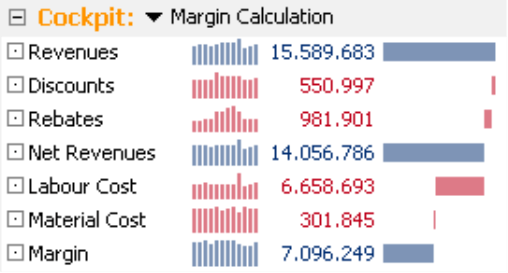
Let’s start with a simple example shown in the screenshot on your right. You have a pivot table that uses a graphical table with waterfall elements and sparklines to illustrate a margin calculation.
In the analytical method Small multiples, select this cockpit and designate it as the template for the report you want to create.
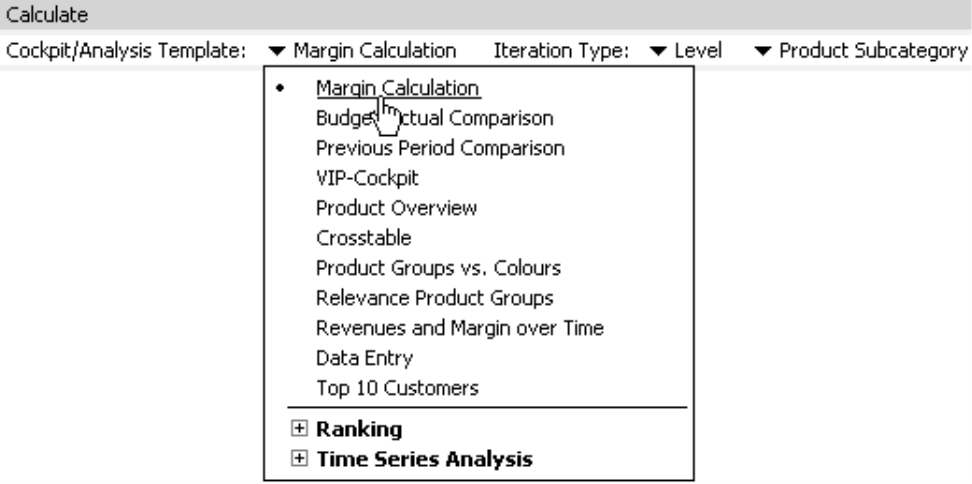
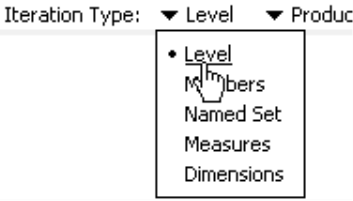
Now select Level as the Iteration type. As a result, the pivot table will be calculated for all members of a certain level of your data model.
In the third step, simply determine the desired level with the help of the hierarchy menu – just as you would in other analytical methods or the Pivot Navigation (see DeltaMaster clicks! 11/2007 for details).
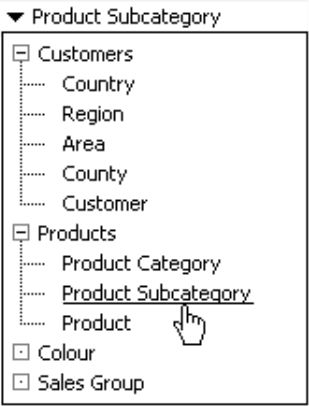
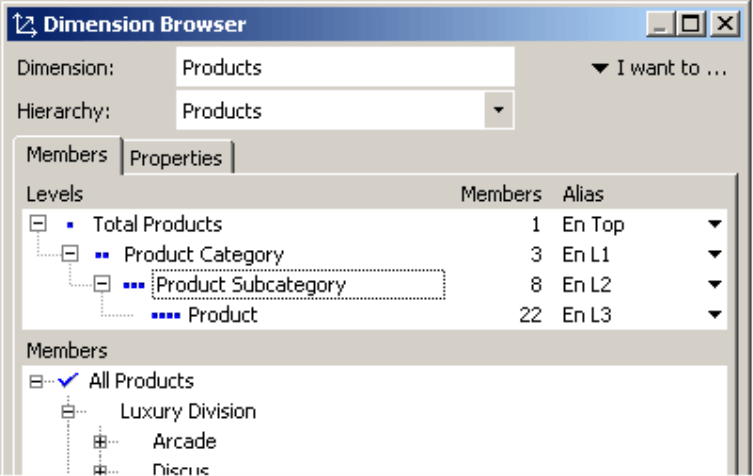
For this example, now select the product subcategory. If you take a peek into the dimension browser, you can see that this level contains eight members. (Note: You do not need the Dimension browser when you use Levels as the Iteration type. They are only shown here to illustrate how the dimension is set up.)
If you now Calculate the analysis, you will receive the following results:
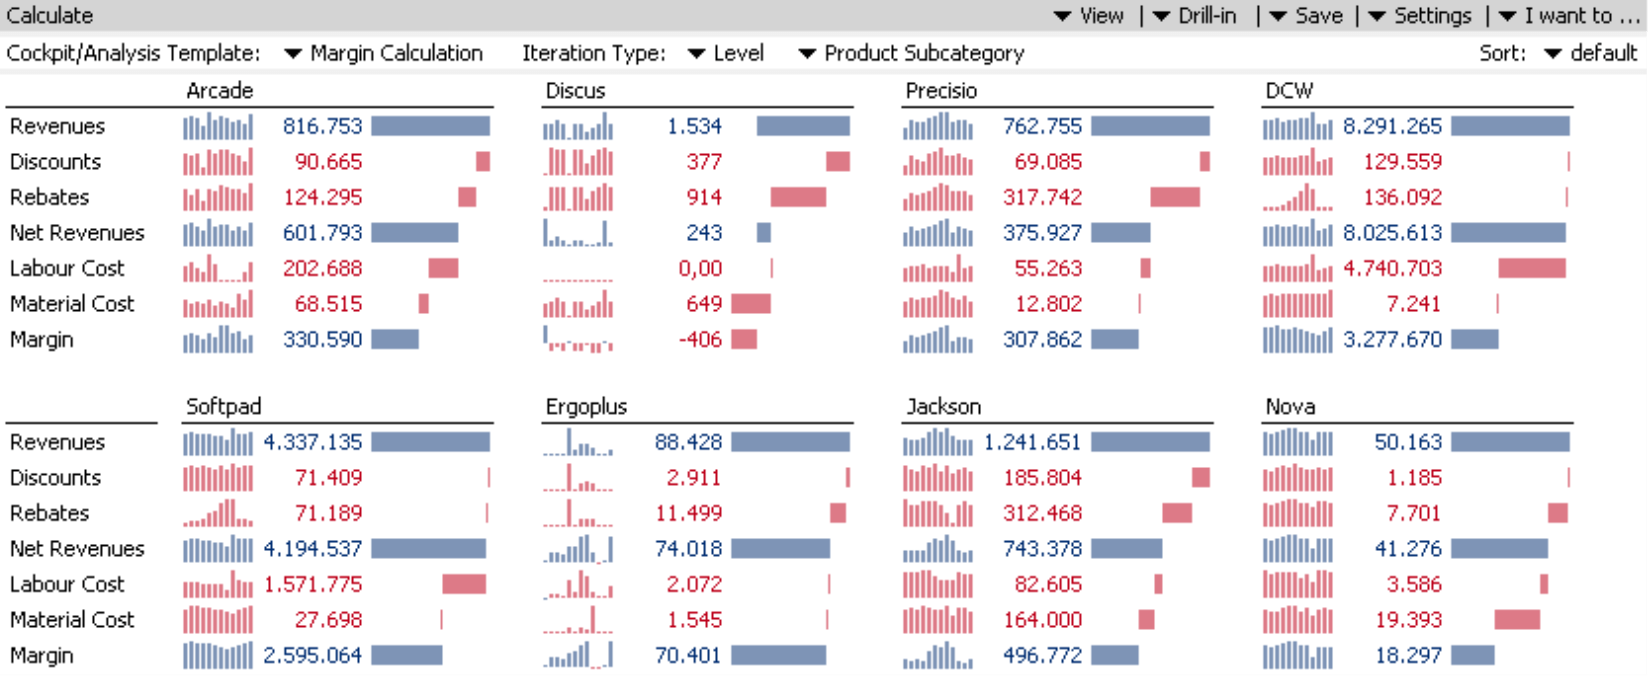
Instead of one pivot table, you now have eight. Using the cockpit that you selected as a template, DeltaMaster calculated one pivot table for each of the members on the product subcategory level and arranged these eight multiples in the available space on the screen. DeltaMaster automatically changed the labeling as well. It kept the names of the measures in both of the multiples on your left and removed them from all others.
Could you have made this same visualization without using small multiples? As far as the content is concerned, you could have easily placed the product dimension on the column axis and set the level of the product subcategory on the axis definition. However, the pivot table would have been so wide that you could not have fit it on your screen without needing scroll bars. This is evident when you see how small you need to scale this screenshot so that you can view the length in its entirety.
![]()
In this small multiples visualization, DeltaMaster automatically moves the individual multiples into several rows. Since the report objects fit on a single screen, you can view them all at once and, therefore, compare them more easily. Although the small multiples haven’t added any new analytical aspects to the report, this type of visualization is much better than the pivot table because it uses the available space much more effectively.
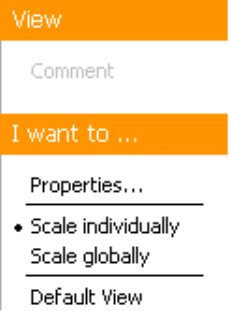
Up until now, the waterfall elements were individually scaled. This means that the longest bar in each multiple always had the same length regardless of its value. Since this formatting ensures the largest possible differentiation, you can compare revenues and profits in each tile more easily. If you are rather interested in seeing the differences among the multiples, however, you should activate a Global scale in the context menu or the I want to… menu. This measures all of the bars and other graphical elements in a scale that applies to all of the multiples.
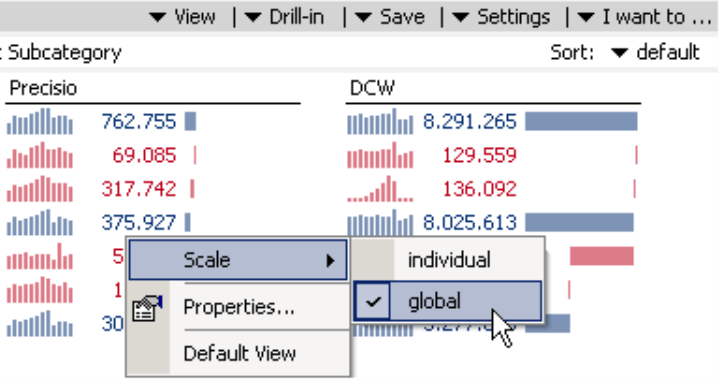
Since the proper scale depends on which questions you have, you can change the scale in all user levels as well as in presentation mode (F5 key, View menu) by ‘touching’ the right side of your screen with your mouse. DeltaMaster will then display the menu shown on your right with specific options based on which report is displayed. In a small multiples report, this includes scaling. For more information on the relationship of scaling options in the template and the scaling options in small multiples, please refer to DeltaMaster deltas! 5.3.7, section 1g.
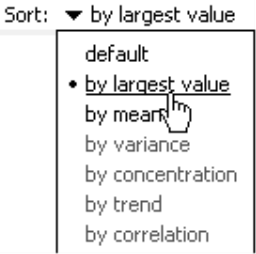
In combination with a global scale, you can also sort the multiples, for example, by the largest value for each multiple. This option is also supported on all user levels. This way, your readers can assign the most important objects at the front of the report and the least important ones at the end.
Since DeltaMaster supports the same options for scaling and ranking in all iteration types, they will not be mentioned in the following sections.
Iteration type ‘level’ (template with dynamic axes)
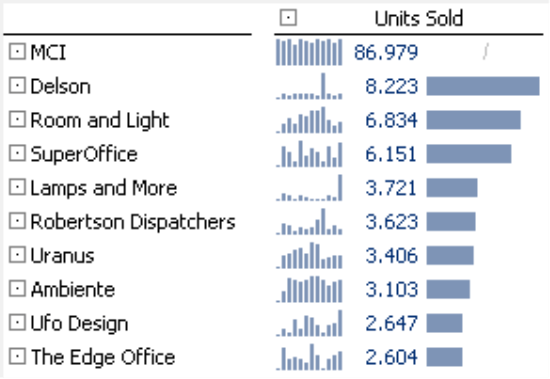
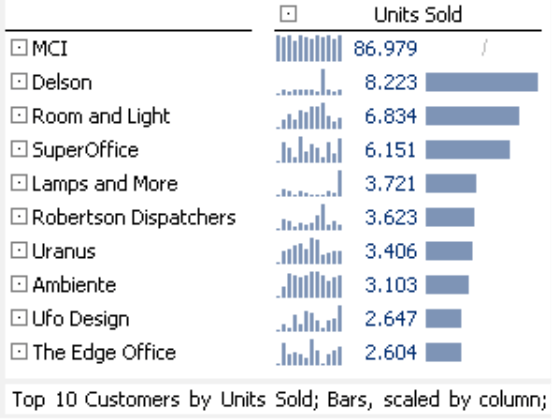
Let’s stay with Level as the iteration type for now and simply change the example. The cockpit on your right shows the 10 most important customers sorted by units sold. On account of the designated sorting and limit options, the values you see in this cockpit don’t only depend on the current View; they also depend on the output in the rows. As a result, the row axis in the cockpit is dynamic as well. MCI, the largest customer based on units sold, is an outlier. Accordingly, DeltaMaster suppressed the bar using the options described in DeltaMaster deltas! 5.4.3, feature #17. A proportional presentation (which is necessary in this case) would draw the scale so that you can no longer see the differences among the other customers. That’s why the bar is hidden in this case.
If now you iterate this template on the color level, you will receive the following report:
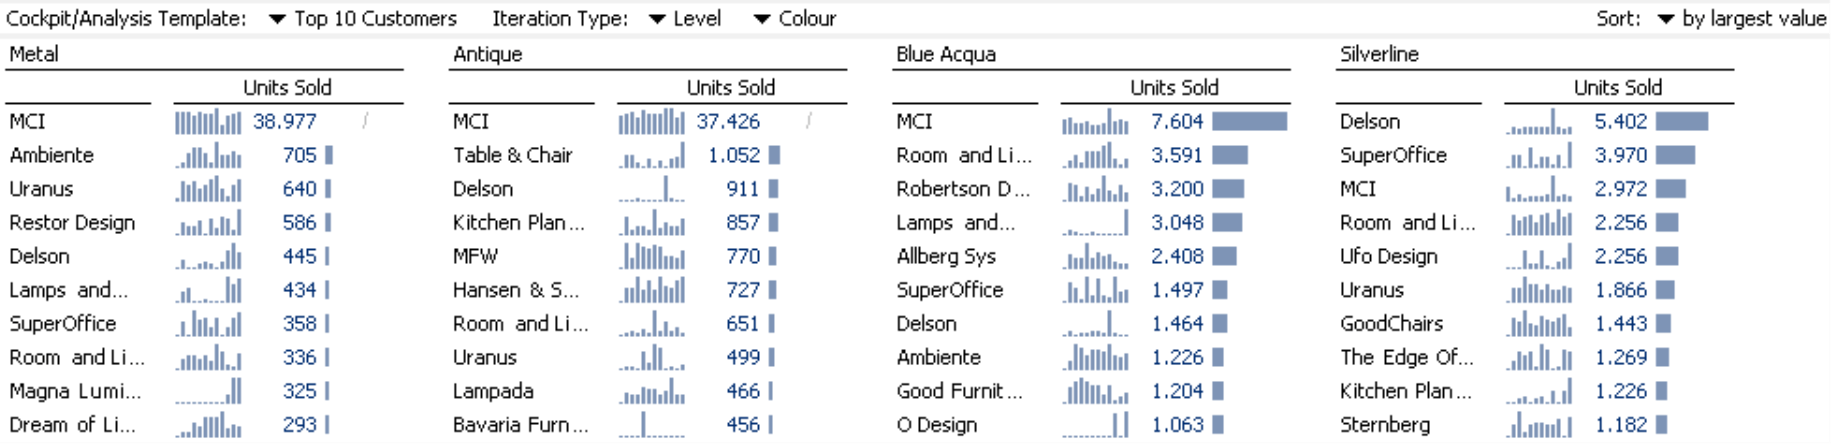
Now you can see the ten most important customers for each of your four colors – each displayed in a separate multiple. DeltaMaster automatically aligns the multiples on the screen. Since the scaling is global, you can compare the bars’ lengths across all four multiples.
Since this report contains different objects in the rows, you could not create this type of visualization with a standard pivot table. Small multiples, therefore, add more value from both a technical as well as informative point of view because they add an analytical aspect to the report you could not explain with a pivot table alone.
As an experienced DeltaMaster user, you may also know that you can create a similar presentation with a combination cockpit. Small multiples, however, are the better choice for several reasons:
- You would have to create a separate pivot table for each member you want to iterate (e.g. each color as in the example above). If you then wanted to color the cell at a later time, you would have to change each of these pivot tables manually. In the case of small multiples, however, all of the multiples are based on a single template.
- You cannot apply a global scale or automatically position the cockpit parts based on the data that is displayed as you can when you create a ranking with small multiples.
- Small multiples flexibly use the entire space that is available on your screen. Since the measurements and position of the cockpit parts are constant in combination cockpits, you must manually place them on the screen. Therefore, if you decide to add new members on the dimension level (for example, additional colors) at a later time, you would need to manually change this in the combination cockpit as well.
If, however, you need to integrate different report elements (for example, two pivot tables, a map and a portfolio analysis), combination cockpits have a clear advantage over small multiples.
Iteration type ‘member’
The iteration type Member is very similar to Level; DeltaMaster calculates different dimension members, tile for file, based on the designated template. Instead of including all of the members on a certain level, however, it only calculates the selected members. (There is a similar difference in the Axis definition of pivot tables, which offers options for a Level selection and Member selection).
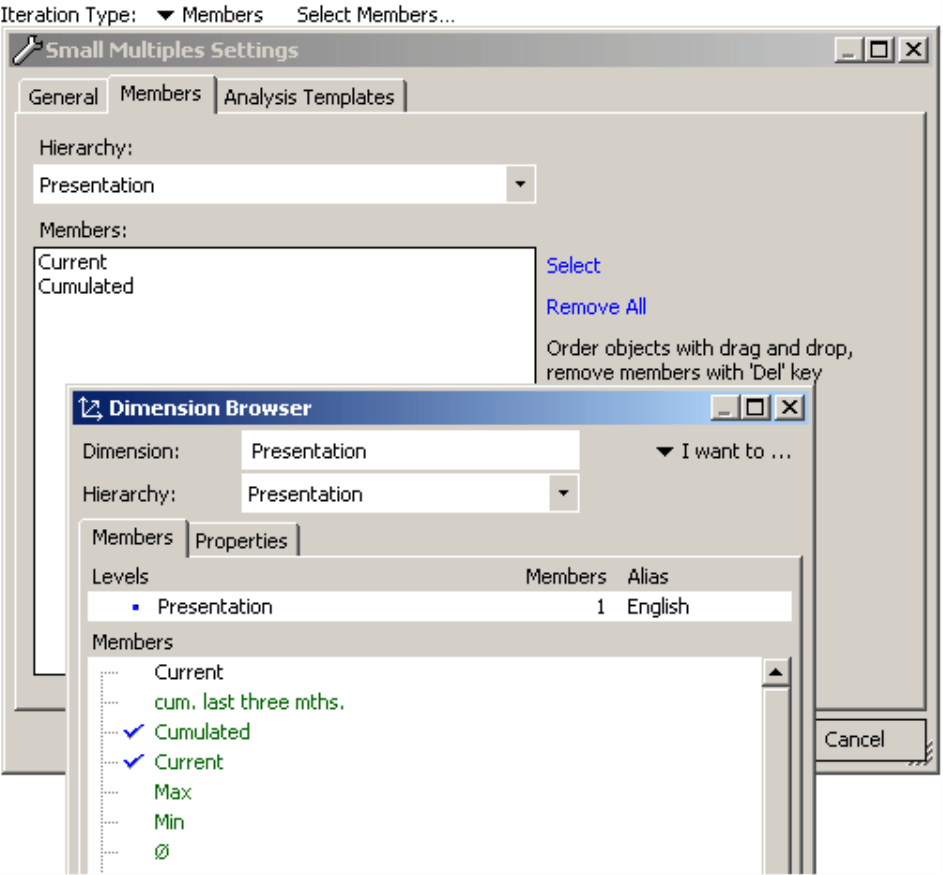
Let’s say, for example, you want to create a list of the most important customers for the current month as well as a cumulated view from the beginning of the year to the current month. Time analysis members, which are usually assigned to an auxiliary dimension (e.g. ‘Time type’, ‘Period view’, ‘Time utility’ – see DeltaMaster clicks! 8/2007 for more information), are ideal for these types of calculations. This dimension often contains a large number of time comparisons. In this case, however, you don’t want to include all of these members in a small multiples report. You only want to focus on two members: ‘Current’ and ‘Cumulated’.
If you choose Members as the Iteration type, you can now click on the link in the menu bar of the Analysis window to Select which members you want. This member selection works exactly as the one in the Dimension browser.
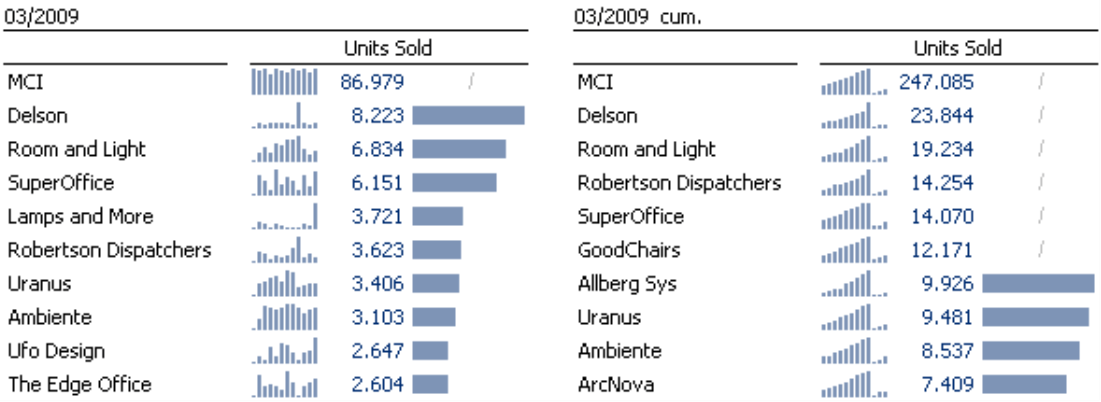
The result shows similarities and differences. The first three places in the current month as well as in the year-to- date standings are held by the same customers. Yet, “Lamps and More“, which has a respectable fifth place in the current month, doesn’t even rank in the top ten of the cumulated ranking. The sparkline for this customer also indicates that the high demand is an exception. If you only observed the current month individually, you might have had a false impression on how important this customer really is.
Here, too, a pivot table would not be a real alternative to small multiples because the rows are different. Creating this type of visualization in a combination cockpit would require more work.
Of course, you can apply this member iteration to more than just auxiliary dimensions. You can use it on all dimensions in which you only want to present certain members, for example, individual countries, customers, products, or services.
Iteration type ‘named sets’
Since DeltaMaster 5.4.5, you can calculate small multiples for the members of a named set. As in the iteration types described on the previous pages, each tile contains another dimension member. In this case, however, you can use the named sets to dynamically choose the dimension members if the named set itself is dynamically defined.
In sales analysis, for example, you sometimes want to see if the demand for a certain product is similar to that of the product subcategory or the product category as a whole. In our ‘Chair’ reference model, that means that you need to select a product as well as its product subcategory and product category. You can do this using an MDX expression, which you can Create as [a] named set (Model menu) in the Named set browser (context menu, I want to… menu).
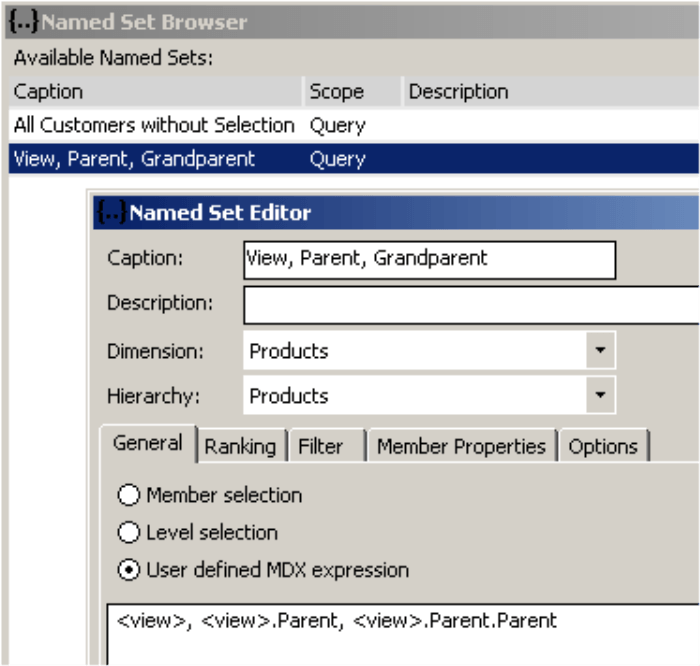
The expression ”<view>, <view>.Parent, <view>.Parent.Parent” selects the member of the product dimension that is selected in the View window (“<view>”) as well as its parent and grandparent. If you place the View on a product (e.g. “Arcade AE 77), the set will include this product as well as its respective subcategory (‘Arcade’) and category (‘Luxury division”).
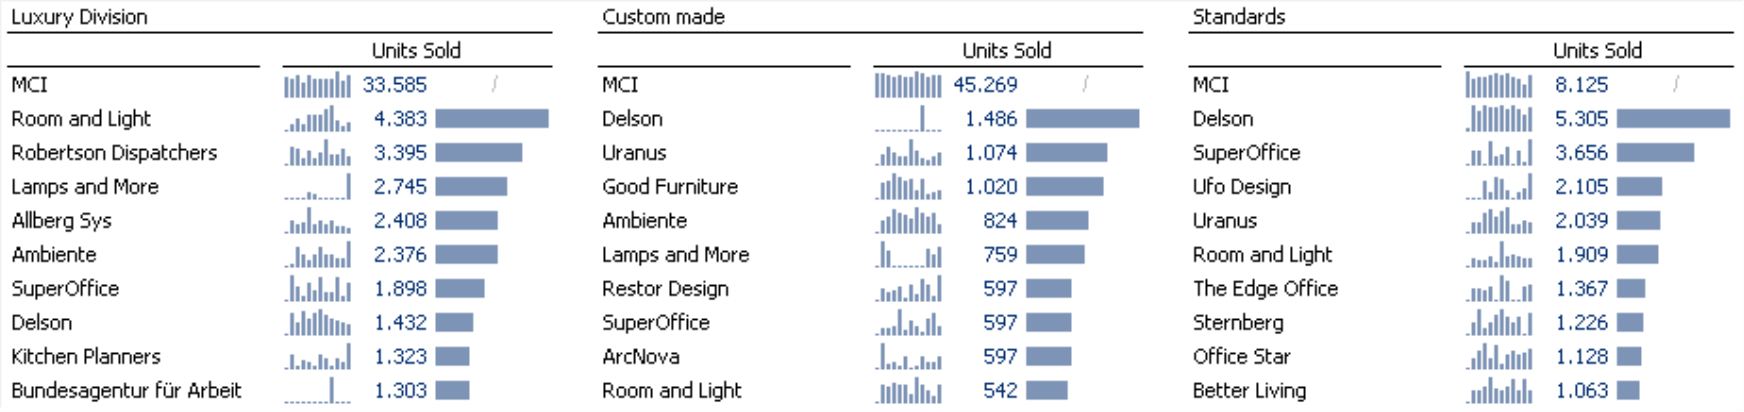
Here’s how this would look in a small multiples report:
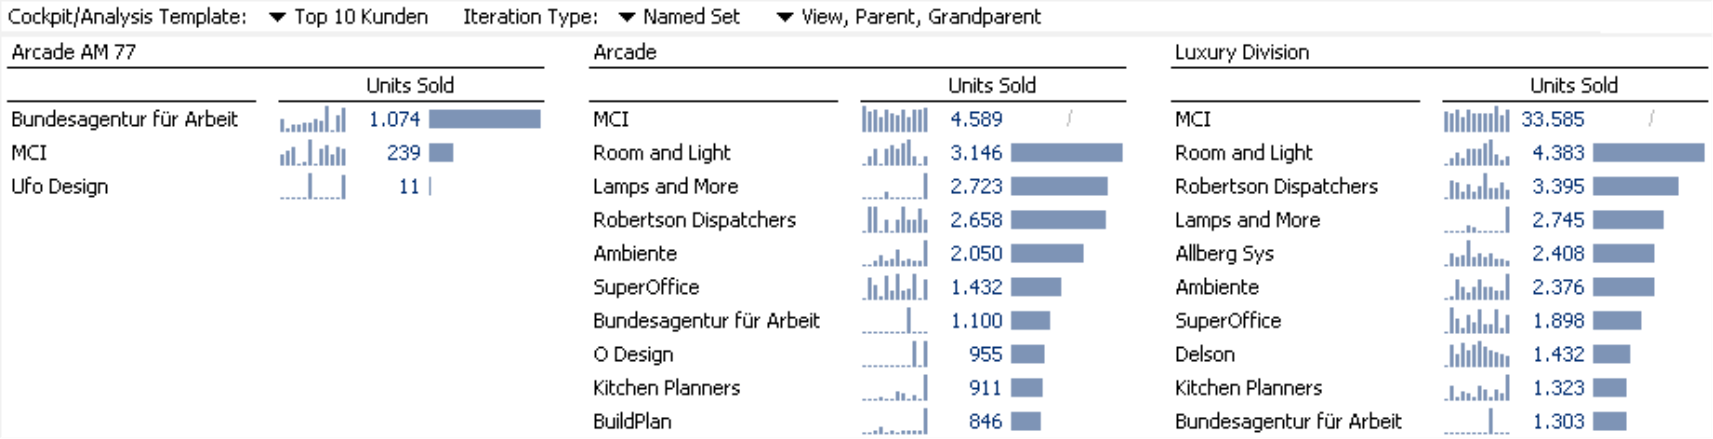
This individual article, the ‘Arcade AM 77’ model, is very important for the customer ‘Bundesagentur für Arbeit’. In the product subcategory ‘Arcade’, however, there are customers who have purchased more units. These customers are important for the ‘Luxury division’, but there are others such as ‘Allberg Sys’ who purchase luxury models that aren’t in the ‘Arcade’ series.
Which members are combined in the named set and, therefore, in the small multiples report, depend on the product that is selected in the View window. And since a user in Viewer mode can interactively change this view, you can provide many different users with this dynamic functionality as long as you have created and saved this type of report in the Briefing book.
Another type of sales analysis scenario would be to create a ranking of customers and a list of the top products per customer. To do this, we need a pivot table showing the units sold, revenues, and similar data on the products – just as we used them in our previous examples – as well as a named set that the customers can sort (e.g. units sold, revenues). Through small multiples you can create a very informative, dynamic, data dense report which you can publish to multiple report recipients as a standard Report.
Iteration type ‘measure’
The previous examples have all used dimension members which were changed as part of a small multiples iteration. DeltaMaster 5.4.5, however, has laid the foundation for iterating pivot tables with measures. (This iteration type was supported in previous versions – just not in combination with pivot tables.) The pivot table that serves as a template, however, must contain exactly one measure. Using Small multiples, DeltaMaster successively replaces this measure through the one that is defined in the small multiples report. The measure that you want to iterate, therefore, should be connected to the dimensions that are used in the pivot table, i.e. particularly they should stem from the same fact table.
Staying with the same example, you can use this type of iteration to determine the top ten customers by units sold, revenues, and margin – without needing an additional cockpit. You simply use the same pivot table that you have used previously as your template in the examples above.
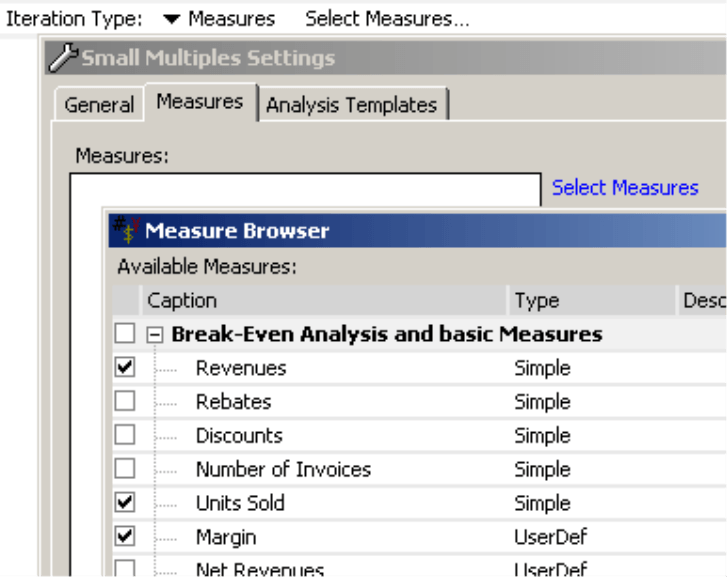
When you switch the Iteration type to Measure, the link in the menu bar of the Analysis window will change and offer you the option to Select measures. From here, you can select the measures you wish just as you normally would in the Measure browser.
The result:
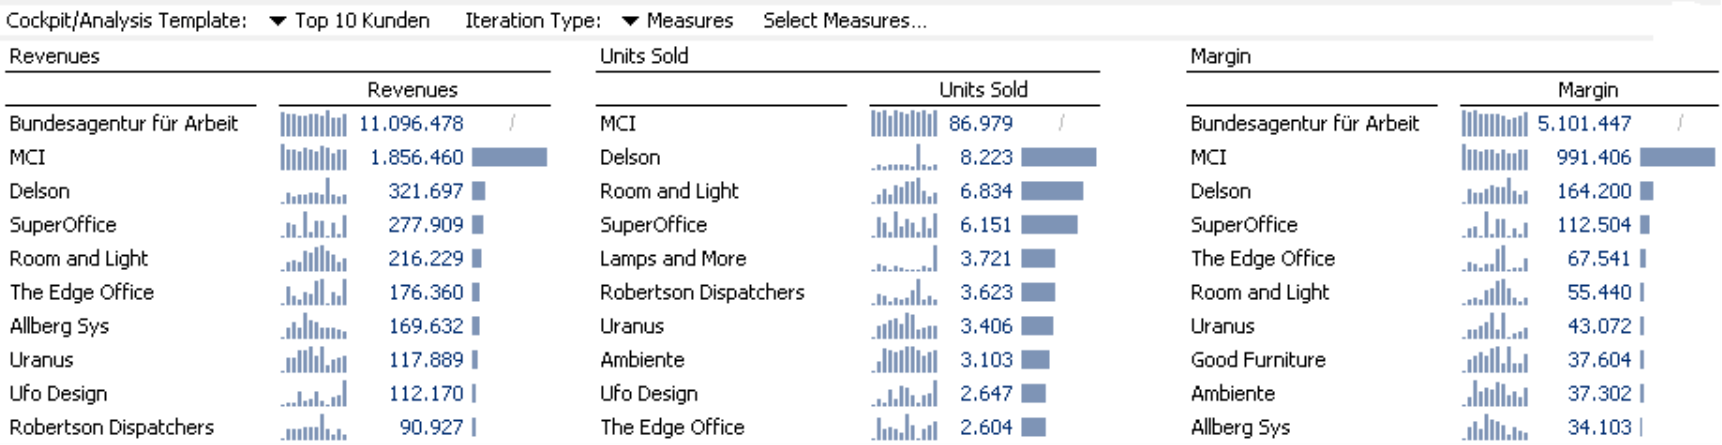
In each tile, DeltaMaster replaced the measure from the template with one of the three selected measures and created a ranking for each one.
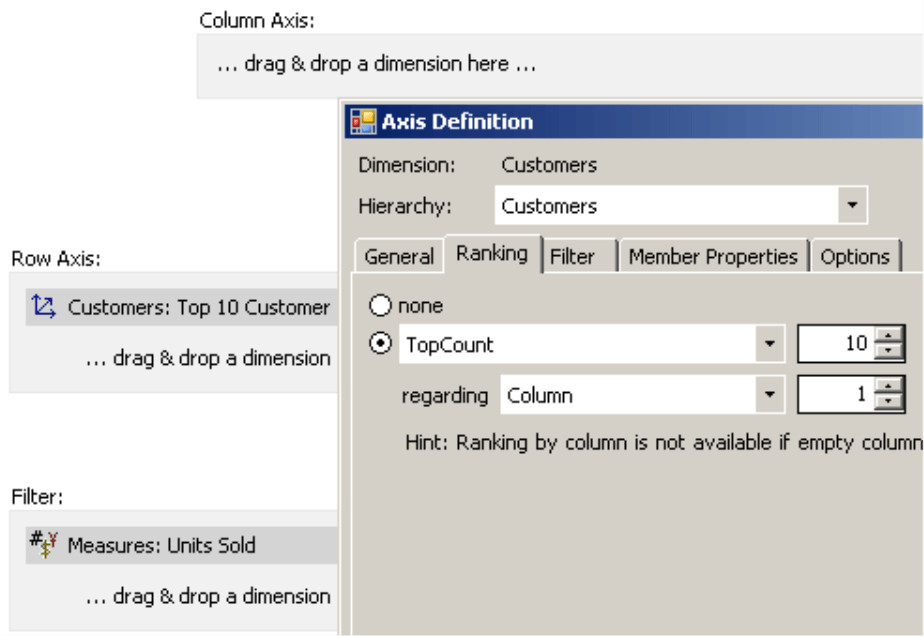
If you want to create a report similar to the one above, you need to note two small details, which you can see on your right in the Cockpit definition (context menu, Change in the Cockpit window) of the template.
- The measure (units sold) is set in the Filter and not on the column or row axis. This ensures that you don’t get double labeling. The Small multiples method generally labels the tiles that it generates with the names of the iterated objects. In this case, you would see ‘Units sold’, ‘Revenues’, etc. listed above the generated tables. If the column was given a headline within the table, the name of the measure would appear twice. That’s why you should create the measure in the Filter of the pivot table.
- In the Axis definition of the row axis where the customers are listed, the Ranking is based on column1 and not the ‘Units sold’ measure. As a result, the dimension members in each tile are sorted by the measure that the Small multiples method placed and calculated in that tile. If you created a ranking based on the measure, DeltaMaster would use the selected measure in the template (the pivot table) to rank the other measures. In other words, the iteration only affects the selected members or measures – and not the ranking or filter options within the pivot table. In this example, therefore, DeltaMaster would sort the revenue and margin statistics based on ‘Units sold’ – which would probably irritate many of your report recipients. Currently, you can only sort a pivot table based on a table column in connection with Microsoft Analysis Services.
Here, too, replicating this functionality with standard pivot tables is not possible because you cannot use them to apply different rankings at the same time and present the results next to each other.
Iteration type ‘dimensions’
The fifth iteration type also replaces a component of a pivot table that serves as a template with the first dimension on the row axis. You can iterate pivot tables with dimensions starting in DeltaMaster 5.4.5 provided that the pivot table contains at least one dimension and the dimensions are located on the row axis. (Note: They cannot be located on the column axis because the measures must be placed there.) The dimensions you want to iterate should fit with the measures located in the pivot table; in particular, they should come from the same fact table. The example with the top ten customers, for example, meets these requirements. The measure (i.e. units sold) is located on the column axis. The dimension members (i.e. the individual customers) are located on the row axis.
If you change the Iteration type to Dimensions, the link in the menu bar of the Analysis window will change and allow you to Select dimensions. You can select the dimensions (even dimension levels, to be exact) just as you normally would, for example, in the Report properties of the Analysis context.
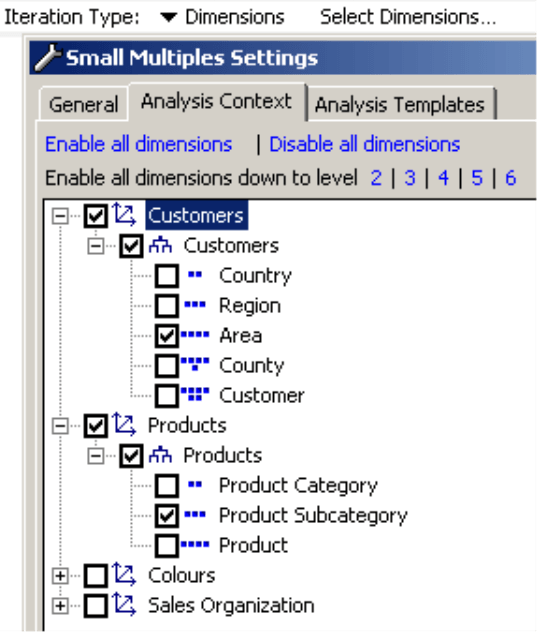
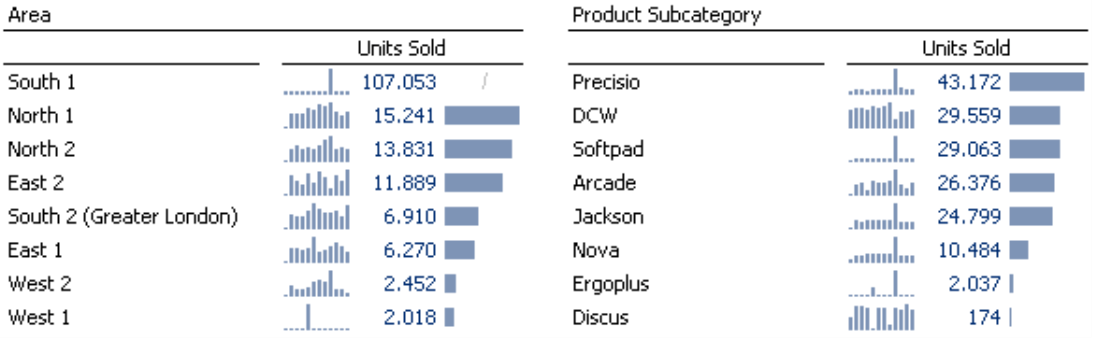
The iteration replaces the customers list from the template with a list of regions (left tile) and then with a list of product subcategories (right tile) based on the settings in your Properties. The ranking (i.e. top ten) and other options react the same way that they do in the template (i.e. the pivot table). In the resulting report, therefore, you can view both perspectives – customer regions and product subcategories – next to each other.
Not just for pivot tables
Our objective in this edition of DeltaMaster clicks! was to illustrate the advantages of combining pivot tables and small multiples as well as how the different iteration types affect your reports. Nevertheless, you can also use small multiples in combination with many other types of cockpits and analytical methods.
Here are just a few of the templates and iterations types that you can use together:
| Level | Members | Named sets | Measures | Dimensions | ||
| + | + | + | (+)1 | (+)2 | ||
| + | + | + | ||||
| + | + | + | + | + | ||
| + | + | + | (+)1 | + | ||
| + | + | + | + | |||
| + | + | + | + | |||
| + | + | + | ||||
| + | + | + | + | + | ||
| 1 Requirements: Pivot table or cross table contains just one measure
2 Requirements: Only dimension(s) on the row axis and measures on the column axis |
||||||
Why not try it yourself? To receive a free evaluation license or get assistance in using small multiples, simply contact your DeltaMaster account manager for more Information.
