![]()
Greetings, fellow data analysts!
Starting with DeltaMaster 6, a number of functions that previously required specific licenses are now available to all users. This includes Browse, Zoom, and Navigate, the three most important functions to start an analysis spontaneously from a given report. Using these functions in DeltaMaster 6 is simple – even for those with little practice or training. This opens many new possibilities to design reports and applications!
The Navigation, in particular, has what it takes to drastically simplify Business Intelligence so it can play a more active role. We warmly recommend this method – so much that we have made it the focus of a small series in DeltaMaster clicks!. It is well worth the effort migrating existing reporting systems to utilize the Navigation and developing new ones for.
We will explain below what report recipients need to know about the Navigation. The next issue will show how report editors can set it up to make it easy for their report consumers – and easy on themselves.
Best regards,
Your Bissantz & Company team
Navigating (the Pivot Navigation) in DeltaMaster is a patented method for expanding Graphical Tables (Pivot Tables) step by step. With each step, it drills down on the initial KPI using a further attribute. This breakdown helps quickly reveal the causes of a variance or the most important drivers of revenues or costs.Report recipients and editors both benefit: The recipients of these clear, easy-to-understand reports have the opportunity to examine the content in detail if necessary. Report editors profit from dynamic, easy-to-maintain reports – and often a reduction in the total amount of reports that they need.
Select cell, start to navigate
The Navigation is supported in all Graphical Tables – in other words, a large portion (possibly even all) of the reports in an application. In DeltaMaster 6, you do not even have to set up the reports first. We do recommend that you configure the Navigation first as we will explain briefly below and in more detail in the next issue. But even without any prep work, you can still navigate any Graphical Table. The handling in the Windows client, the WebClient, and the App for iPhone and iPad is identical:
- Select the value that you want to analyze by tapping or clicking (once) on the respective cell. The selected cell will have a dotted border.
- Run a Navigation step. You can do this in one of three ways:
- through the Analysis Menu below the report (Navigate: +, Auto, –),
- through the menu that DeltaMaster directly offers at the bottom of the selected cell (with a small black triangle), or
- with a double click on the value.
You can repeat this sequence (i.e. selecting a value, running the Navigation) as long as there are still available attributes that can appear but have not yet been displayed in the table. In this way, the analysis becomes more and more granular, yet remains easy to use and read: one cell, one step, one more attribute. In most cases, you do not even need to select the cell for the next step because DeltaMaster moves the selection marker with each step and automatically selects the next cell.
You can analyze the selected value in one of three ways:
a) with the Predefined Navigation along an analysis path that a report editor has defined in advance;
b) with the Automatic Navigation along an analysis path that DeltaMaster automatically takes based on a data mining method; and
c) with the User-defined Navigation along an analysis path that you choose step by step.
You can run the Predefined and Automatic Navigation through the Analysis Menu. For a User-defined Navigation, use the Hierarchy Menu that you can display at the data cells.
Analysis Menu: Predefined and Automatic Navigation
In the Analysis Menu (below the report), click on or tap the Navigate button to display the Plus, Auto, and Minus buttons.
![]()
- Plus will run a(nother) Navigation step starting with the selected cell. This expands the table with an additional dimension as shown below – provided that a cell containing a value is selected as the starting point. If a suitable cell is not selected, DeltaMaster will call this to your attention.
- Minus undoes the last Navigation step. This removes an attribute from the table, thereby making it smaller – provided that the selected cell was entered in the table by navigating.
The fastest and easiest way to navigate a table is to double click on a cell. This runs a step with the predefined Navigation, even if you have not activated the Navigate function in the Analysis Menu.
Which dimensions DeltaMaster enters in which order and sort order depends on the settings predefined in the Edit mode (typically by the report editor). This simplifies the handling for all report recipients. It also helps promote standardization by creating uniform guidelines for discussing the numbers and establishing a standard agenda. If no steps have been predefined or you have already run all predefined steps, DeltaMaster will point this out.
If you want to run the Automatic Navigation you activate the function with the respective button. Before each step, DeltaMaster will automatically calculate which attribute will be inserted next. A data mining algorithm examines which criteria are still available and automatically selects the most interesting one. This Navigation also works when no steps have been predefined. Also after the Predefined or User-defined Navigation and even in alternation with them, you can let the Automatic Navigation guide the way.
![]()
The fastest and easiest way to navigate automatically is to double click while holding the Ctrl key. This runs a step with the Automatic Navigation regardless if a Predefined Navigation is available or not.
After each navigation step, DeltaMaster will automatically move the selection marker to select the next logical cell: the first of the newly displayed cells. This is the most important value for the next step because it is the largest or smallest depending on the defined sort order. Pay attention to the dotted border – it shows which cell is selected and, therefore, what is the starting point for the next step. This allows you to analyze deeper with just a single control: clicking Plus again and again.
Hierarchy Menu at the data cells: User-defined Navigation
The User-defined Navigation helps answer specific questions that go beyond a predefined or automatically calculated path. If you point your mouse on the bottom part of a cell, a small black arrow will appear. If you mouse over this arrow, DeltaMaster will open a menu that offers all attributes (dimensions, hierarchies and levels) where you can drill-down for further details.
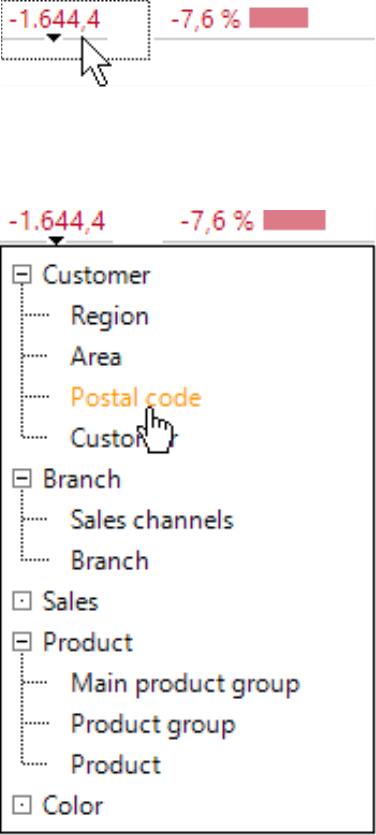
Click on the desired attribute to run a navigation step in this direction, i.e. to drill down on it.
The possible selections in the menu are dynamic and change with each step. They depend, among other things, on which attribute are already contained in the table or fixed in the Filter Bar (above the report): Each attribute (or better said, each level) can only be used once. Accordingly, the menu shrinks with each navigation step until no further dimensions are available. The menu primarily depends on the so-called Navigation Context, in other words, the set of dimensions, hierarchies, and levels that you can possibly select in this report – mostly a small selection from the data model. This context is defined in the Edit mode (so typically by the report editor).
That means: If you feel that the menu is too long and contains too many attributes, you (or a report editor) can shorten it in the Edit mode. Defining a Navigation Context is simple as we will explain in the next edition of clicks!. In the Edit mode, you can also change the names of hierarchies and levels. That means if some of the options in the menu have strange names or look more like technical terms than business names, you can solve this issue quickly in DeltaMaster.
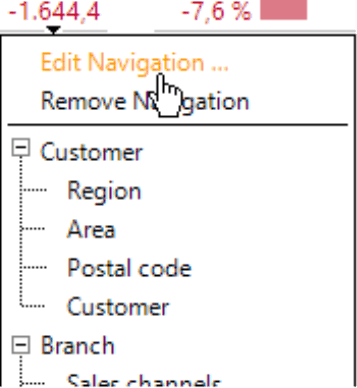
If you need very specific information, you can edit the Navigation for a step that you have already run and, for example, change the sort order, display more/ fewer rows, or set numerical filters. This entry is available in the Hierarchy Menu of the cells with a gray arrow. (These are the cells where the Navigation that you want to change begins). This will open a dialog box that is similar to the Axis Definition, which is very familiar to report editors. Report recipients usually do not modify the Navigation themselves.
Reading the Navigation
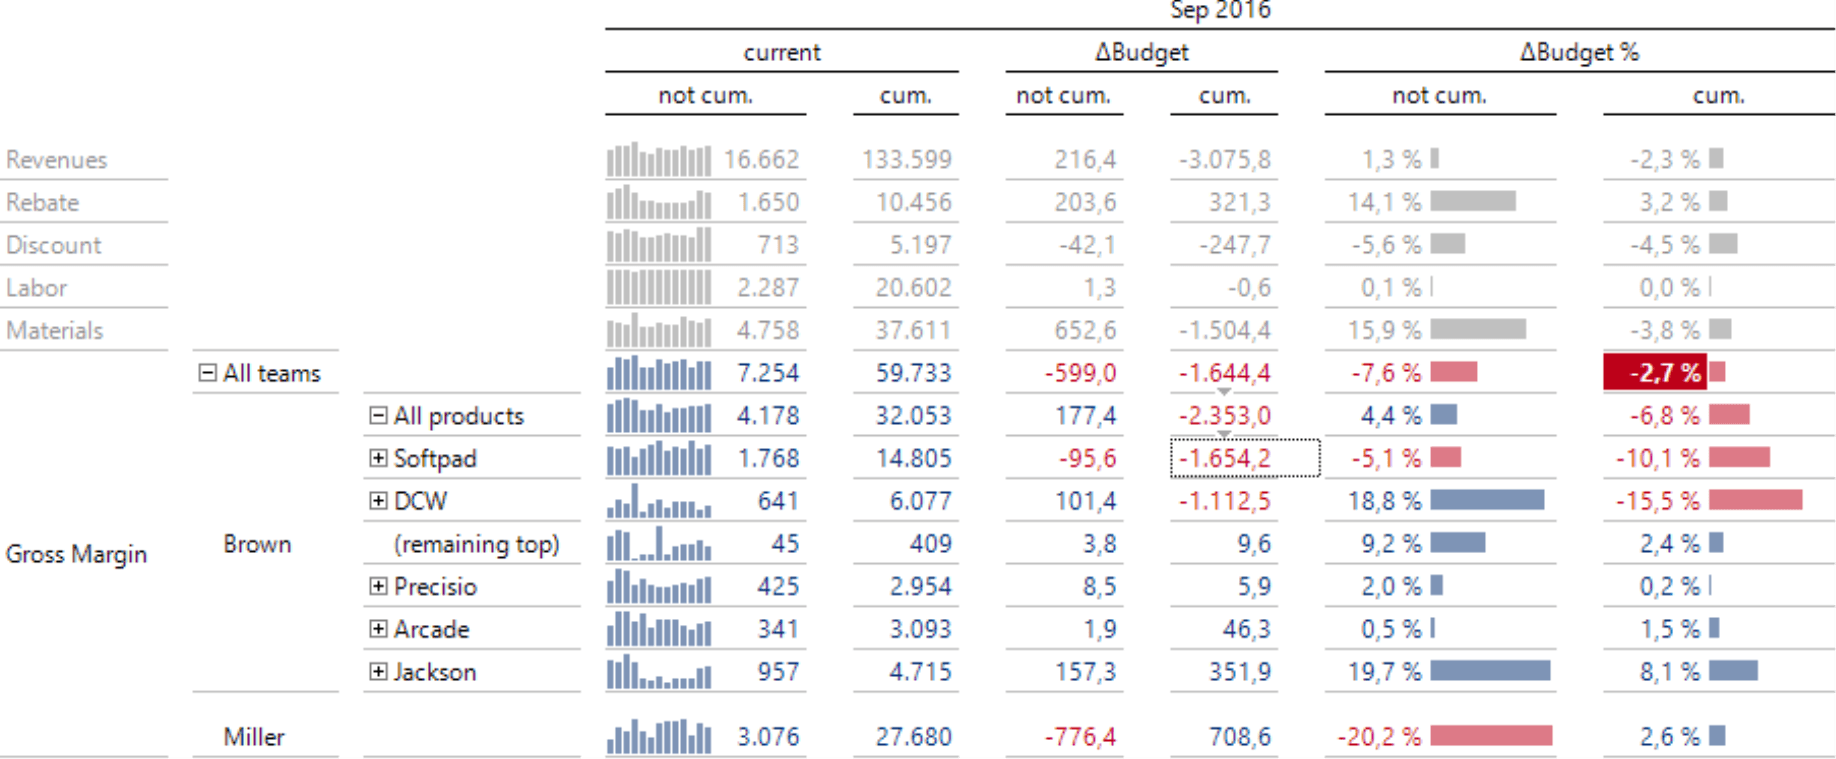
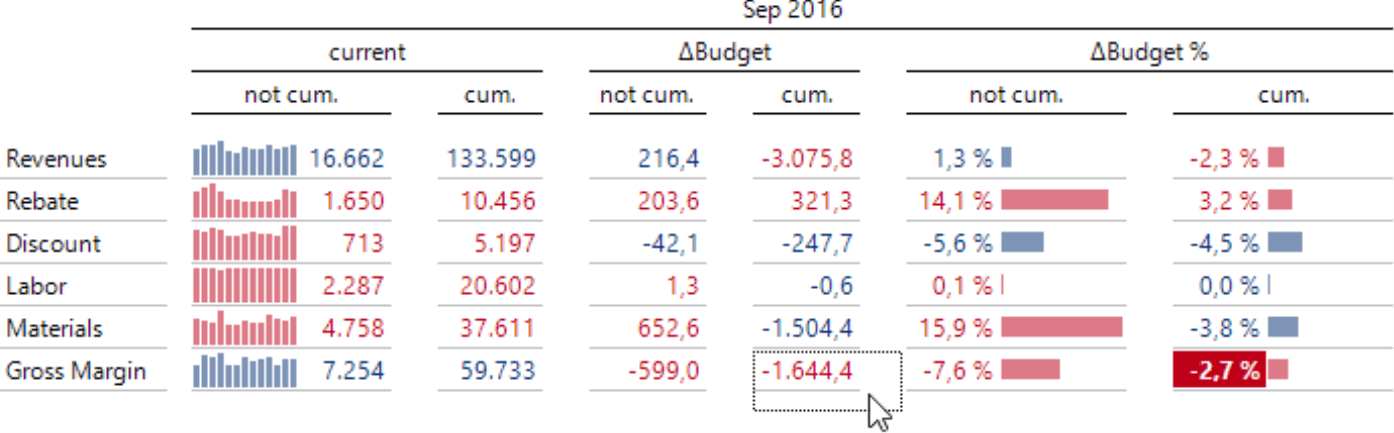
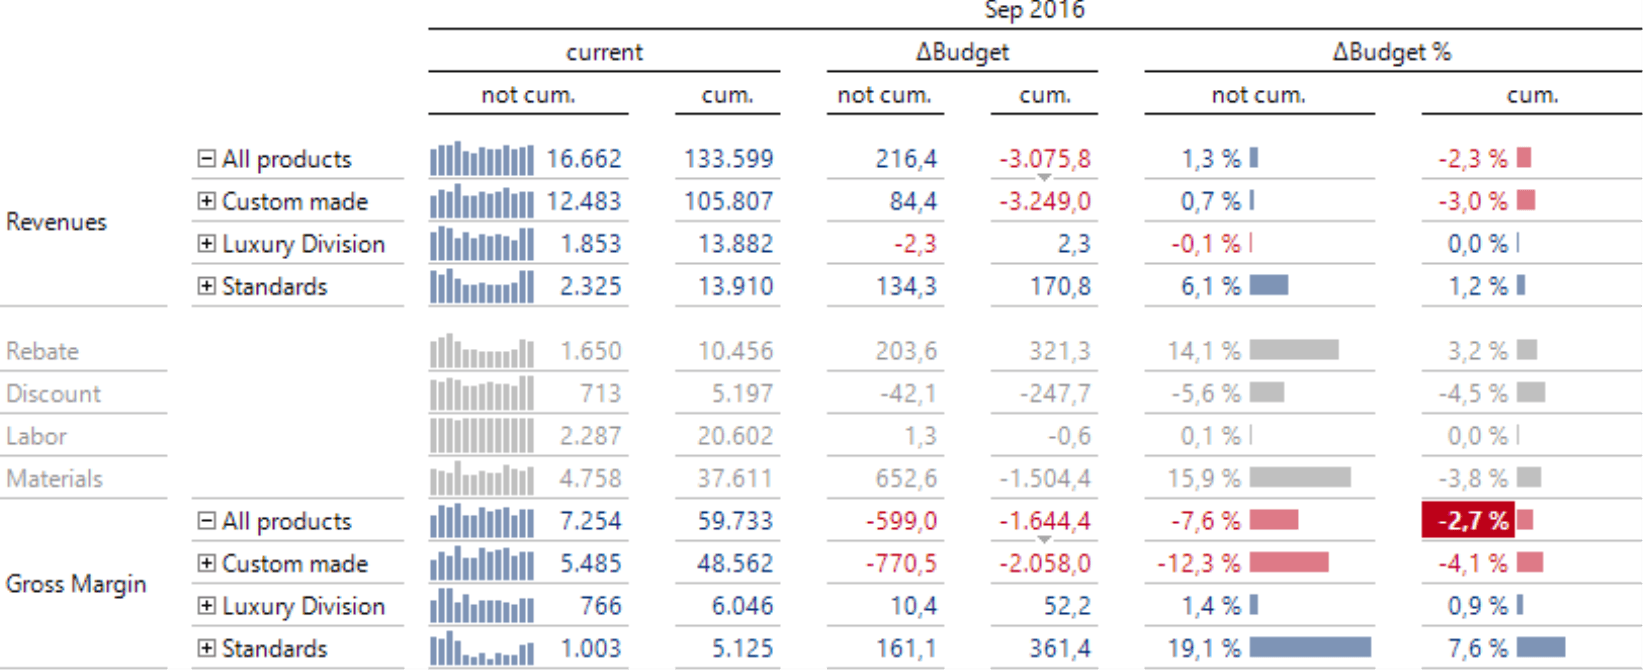
We will use the following example to show how the Navigation evolves and how to read it in the report. Although this is actually self-explanatory, we wanted to do this for the sake of completeness. Our example starts with a budget-actual comparison. What interests us is the variance in planned margin with the amount of -2.7 percent or the respective absolute value (1,644.4). We have already selected this cell as you can see based on the dotted border.
Step one breaks down the initial value by sales teams. Since this was set up as a Predefined Navigation, we can run this step and all others by clicking the Plus button in the Analysis Menu.
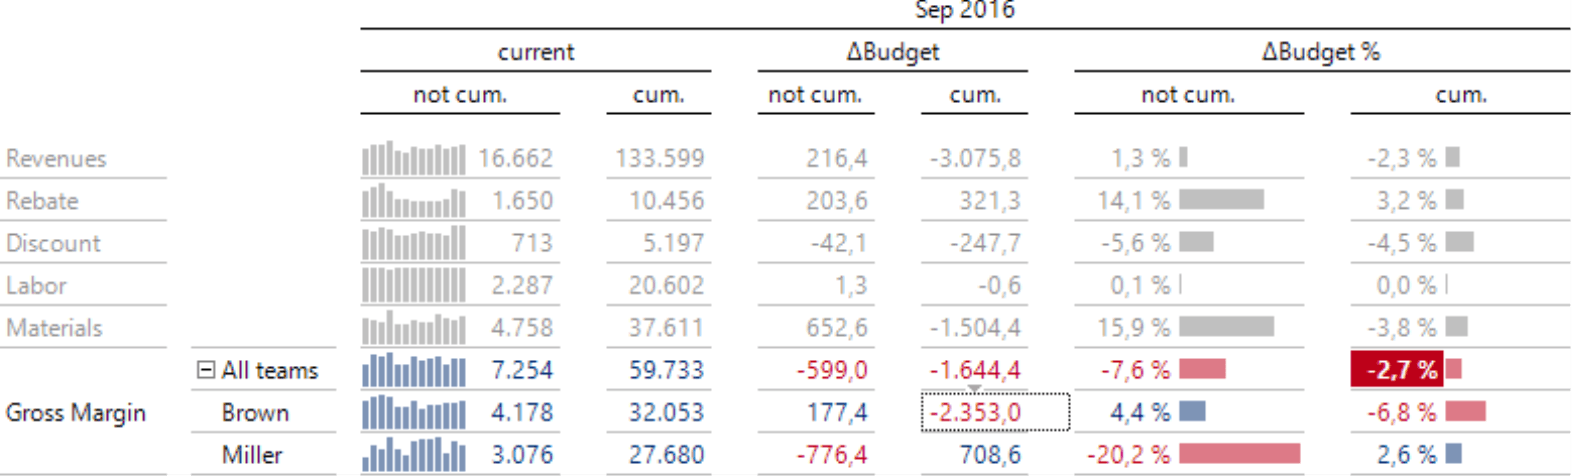
DeltaMaster enters both sales teams as new rows in the table and displays an additional column with the labels (All teams, Brown, Miller). A small gray arrow at the bottom of the initial cell marks the starting point of the Navigation, in other words, which value was broken down. The selection marker automatically moves to the first new member that was added. This is the single most important cause of the variance. The table sections that were not drilled down further are now gray to emphasize the area being analyzed in more detail.
The next step drills down further into the variance of the most important causer (Brown, ?2,353.0).

DeltaMaster once again adds a few more rows: the products that caused the variance within Brown’s team. Two gray arrows mark the Navigation path in the data cells. DeltaMaster automatically moved the selection marker (dotted border) again, now to the most important product group (Softpad). You can clearly see that the new rows are sorted in ascending order based on the budget variance, from the worst negative variance with Softpad (?1,654.2) to the largest positive variance with Jackson (351.9). Two members have negative variances and several have positive variances. DeltaMaster only displays the three largest variances respectively and combines the rest into “remaining top”. This is typical for the Navigation, which only adds (and sorts) the most important members in each step. You can define exactly how many members it selects and how they are sorted in the Edit mode. Here you can also activate the option to combine the remaining members in a group. For the record, the members were sorted in the previous step as well, but it is not so obvious when there are only two members.
The next step breaks down the variance for the most important product group: Softpad.
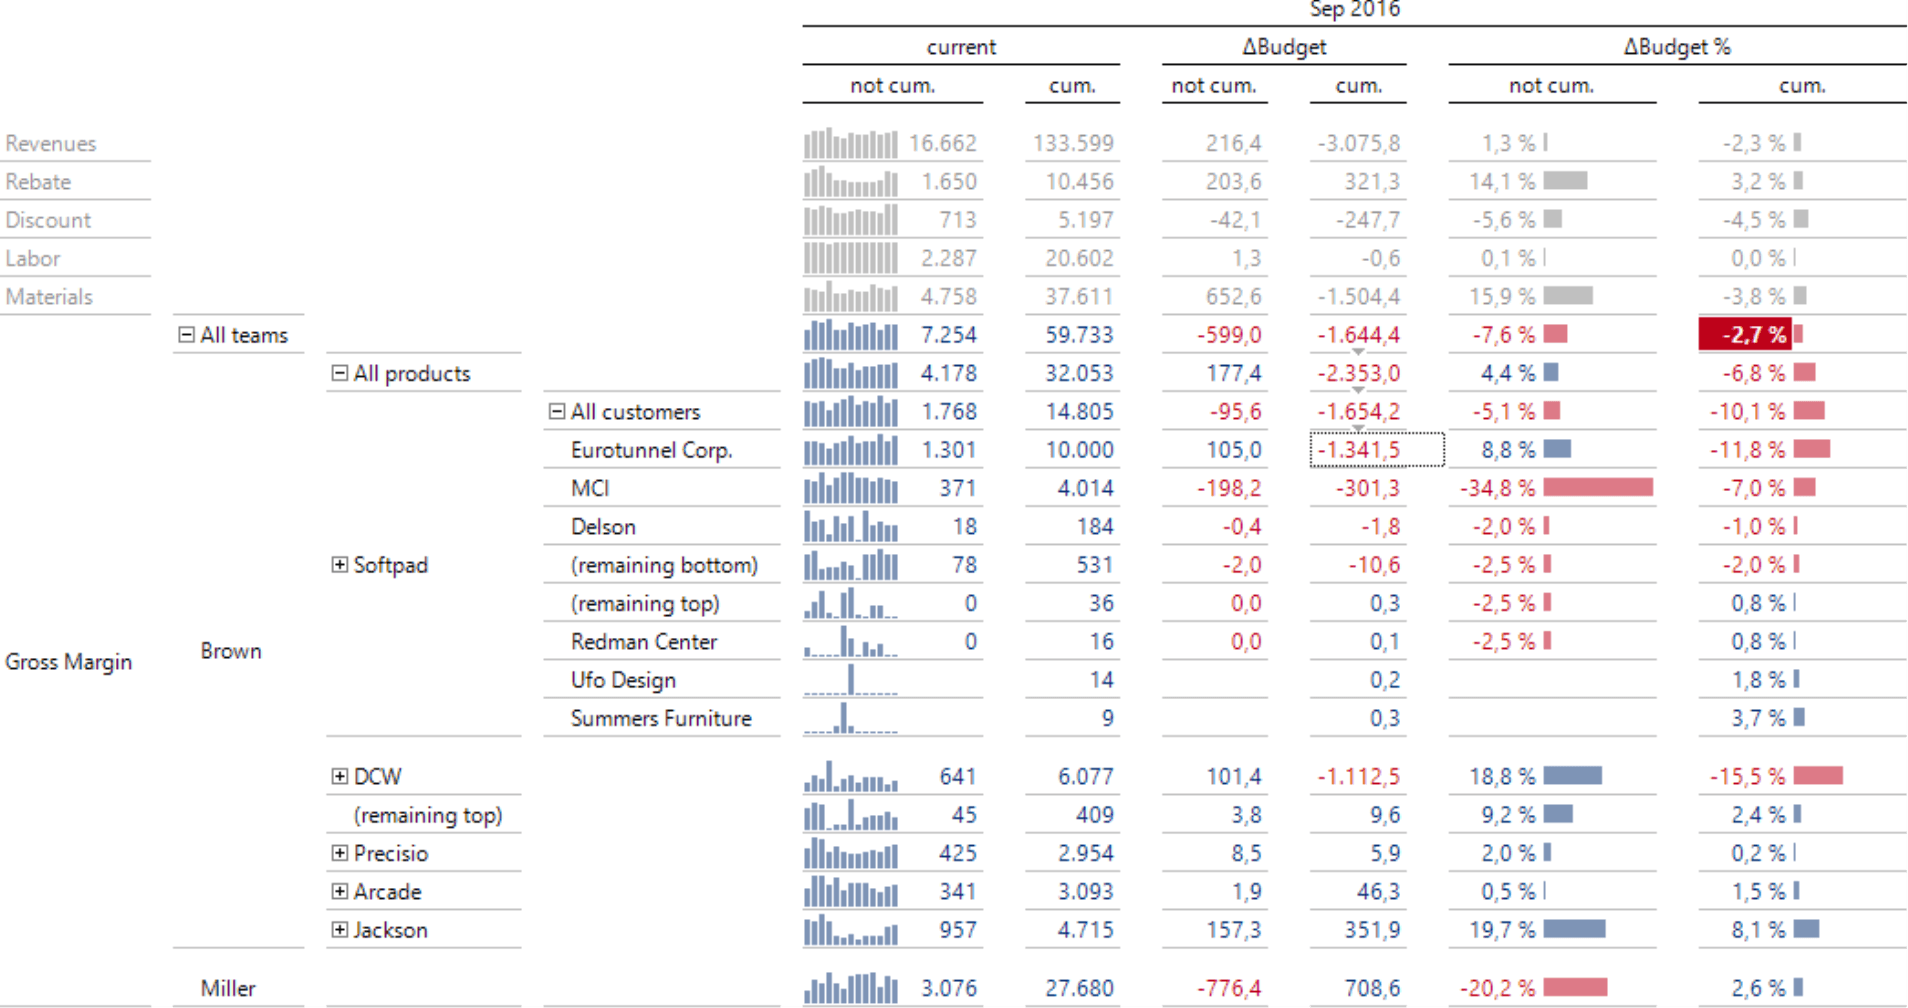
This again adds new rows to the table: the customers of the most important product that has primarily caused the variance in Brown’s team. Three gray arrows mark the Navigation path in the data cells. DeltaMaster once again automatically moves the selection marker (dotted border) – now to the value of the most important customer (Eurotunnel Corp, ?1,341.5). This means that you only need to click the Plus button in the Analysis Menu for this next step.
The row headers create a wedge-shaped pattern where you can view the details step by step. DeltaMaster also documents the individual steps in the status bar below the report.
![]()
This shows which attribute was added in each step, for example, “Product group”. It also displays how the members are sorted, for example, “Bottom/Top”. This means the largest and smallest members together, which is very interesting in the case of variances (see DeltaMaster clicks! 02/2015 for more information).
Navigating for further members
In the most common cases for using the Navigation, you will probably want to break down one starting value in more detail as in the example above. Nevertheless, you can also repeat the analysis path you have taken for other initial values. That can produce very informative visualizations. For example, you might want to compare the variances for revenues to the variances for gross margin. The Navigation makes it possible.
A further navigation step can be added not just to the last step, but even to any cell – inside the Navigation area or also outside (in gray). When you start in a column where you have already used the Navigation and run the same steps as you did before, DeltaMaster will display the new sequence alongside the existing one(s).
Navigating in the Web browser and App
All three Navigation methods (Predefined, Automatic, User-defined) also work with the WebClient, i.e. in the Web browser and in the DeltaMaster App for iPhone and iPad.
When using the App, please note that when reports that are larger than the available screen space, they will automatically be displayed a bit smaller. Tap once on the report to display them in the original size. Navigation is only supported when reports are in their original size (not the smaller display). To start the User-defined Navigation, tap and hold the desired cell until the Hierarchy Menu opens. The Web browser supports the same double click operation as the Windows client: double click to start a Predefined Navigation, Ctrl + double click to start an Automatic Navigation. There is no equivalent, however, in the App.
The functionality to subsequently edit a User-defined Navigation is not available for the Web browser and the App. The sort order, in other words, is always based on the default setting in the report and cannot be changed for individual steps.
DeltaMaster 5: Same handling, different licensing
The Navigation tips and instructions described above have been written for DeltaMaster 6, but are also valid for DeltaMaster 5. The differences lie in the licensing: The Pivot Navigation in DeltaMaster 5 belongs to Miner mode. You can also use it in Viewer, Pivotizer, and Analyzer modes with a separate license (Navigation Option, see DeltaMaster clicks! 04/2014). The WebOption of DeltaMaster 5 also supports Pivot Navigation. The App, however, requires DeltaMaster 6.
