![]()
Greetings, fellow data analysts!
The shortest route between Boston and Philadelphia is 490 kilometers. That is about the distance of the longest stage ever at the Tour de France – and only one of fifteen at the 1919 tour. Like always, there was a proud winner at the end of the day’s race. Someone else, however, wore the famous yellow jersey (Maillot Jaune). Outstanding performance during one stage of a race is one thing; however, it’s the overall classification that really counts.
In business, it is no different. That’s why you review the numbers for the past month as well as the months prior to it. That is called the “year to date” or a cumulation. This edition of DeltaMaster clicks! will show how you can handle these types of calculations with DeltaMaster. Use them to help your business contend for the yellow jersey – without you even having to break a sweat.
Best regards
Your Bissantz & Company team
In the standard reports generated by the Start Wizard of DeltaMaster, cumulated values play an important role and are always positioned directly next to non-cumulated values – a central characteristic of these reports. The Start Wizard can also create the necessary calculations in the analysis model. In this edition of clicks!, we will take a closer look at cumulations, explain why they are so important for standard reports and management information as a whole, and show different ways to work with cumulated values in DeltaMaster.
When we talk about a “cumulation”, we mean adding up the values of several periods with a fixed start and a flexible end period. This summation is also called “year to date” (YTD). The start period is typically the first month of the (fiscal) year but can also be the first day of the quarter (“quarter to date“, QTD), the first day of the month (“month to date“, MTD), the start of a shift, etc. The end period is the current month, day, hour, etc. – with “current” here meaning the report period defined in the View of DeltaMaster. The fixed starting period differentiates the cumulation from a rolling aggregation. A rolling aggregation, in comparison, has a constant length such as the past 12 months (“moving annual total”, MAT) which determines the starting point.
Non-cumulated and cumulated values: always together
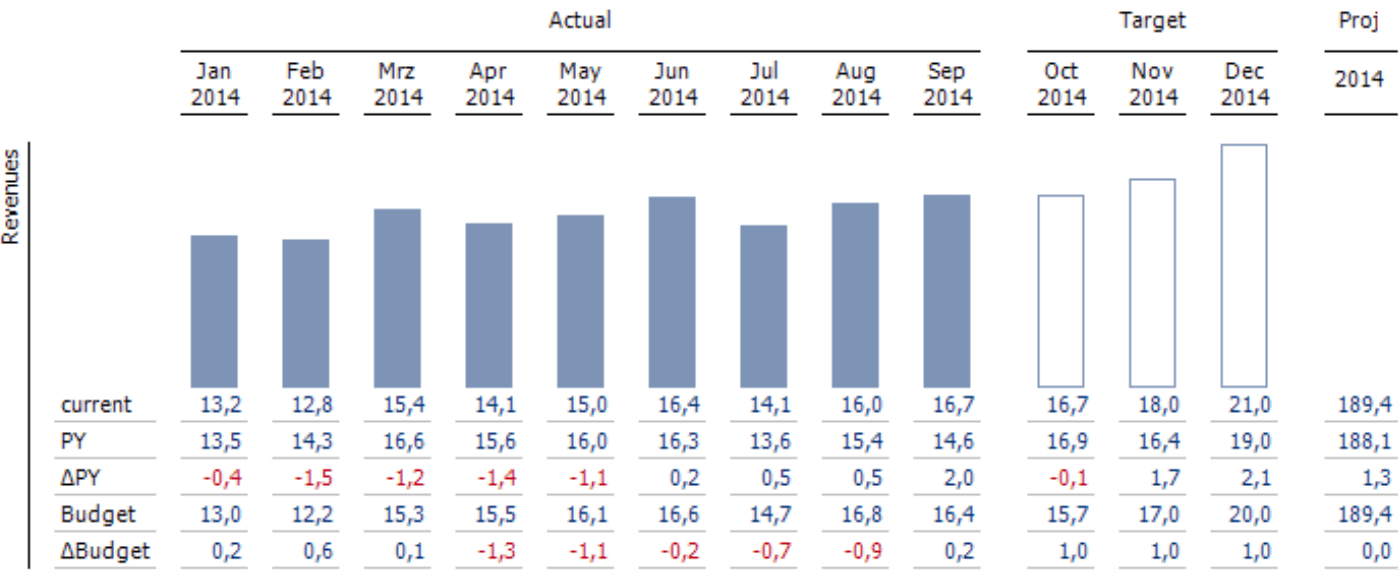
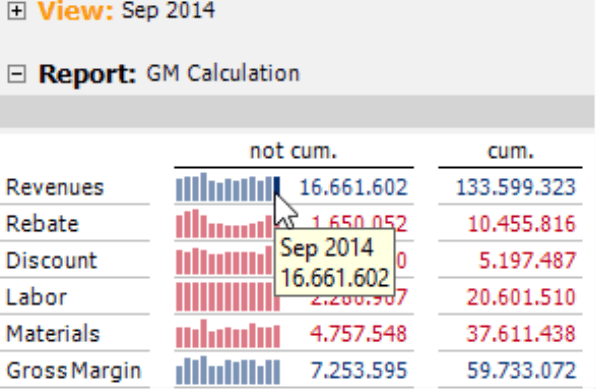
The standard reports in DeltaMaster display the current and cumulated values for all comparison types (i.e. current month, variance to the previous year, variance to budget) directly next to each other instead of combining the non-cumulated values in one group and the cumulated values in another. The cumulation, therefore, is the innermost nested dimension on the column axis.
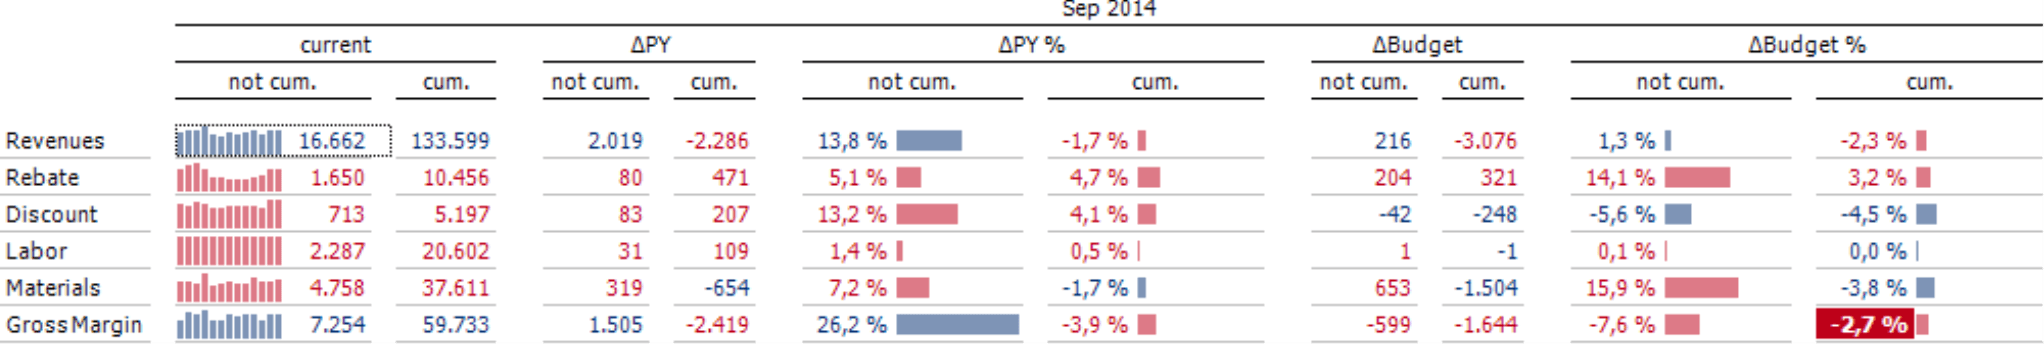
That is how the Start Wizard creates it in the Axis Definition, and we recommend the same basic layout for reports that you create without Start Wizard as well. This structure is based on the premise that you should always view the current month in the context of the business year leading up to that point. Before you discuss the difference between the variance to the previous year and a variance to budget, you should first know if the respective monthly variance differs from the cumulated variance. These cumulated values help you view the current month’s performance in the context of the year so far, see if it is representative, and calculate its contribution to the overall results. This is why they are placed next to each other in the report. You need the cumulation so you can classify the current month. And if there is not enough room in your report to list all value types and comparisons, the cumulation is often more important than the individual values. In other words, it makes more sense to omit the monthly variance than the cumulated variances.
The visualizations in DeltaMaster support this concept. The bars use a global scale, which makes them comparable across all columns. Just by viewing the bar pattern, you get an idea of the current month’s performance. The pattern in the left column is chaotic. The differences in length are larger than in the right column, and some bars are much longer than the longest bar on the right. This visual disorder signifies that business in this month was probably turbulent as well, and that this month does not fit in the picture of the year. That is important to help interpret the content.
Cumulation member
To display the cumulation in DeltaMaster applications, you typically use so-called time analysis members. These calculated members are created in DeltaMaster or the underlying (OLAP) database as an additional “switch” in a dimension. Their job is to run various queries and calculations on the time axis, always starting from the current time period, either as defined in the View or resulting from the structure of pivot tables. With time analysis members, you can for example query the value of the previous month or the respective month in the previous year, calculate the variance between these values and the current one, or add up all of the values from a dynamically defined time series (i.e. a cumulation).
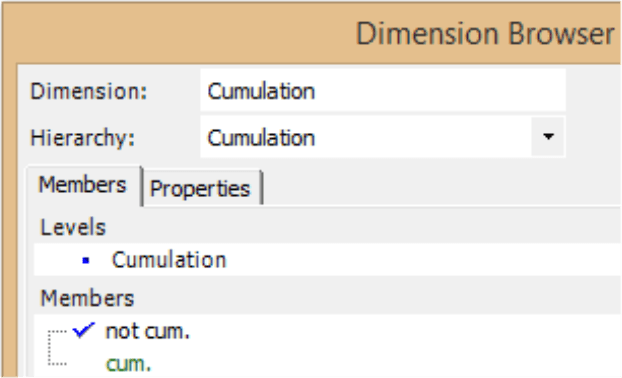
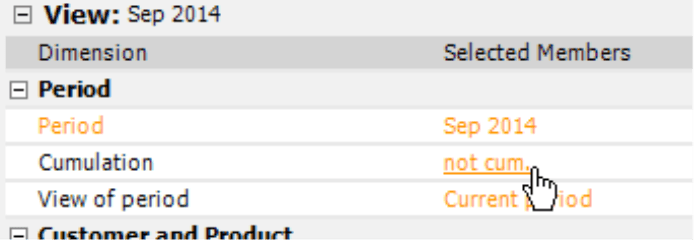
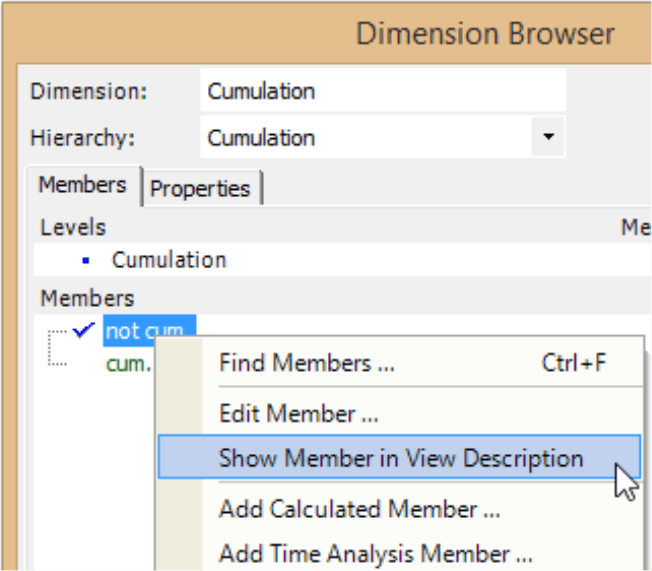
In most cases, that looks like the screenshot on your right. There are two members: “non-cumulated” as a reference member from the database (written in black) and “cumulated” as a calculated cumulation member (written in green if it was defined in DeltaMaster).
This method of modeling is extremely flexible:
- Since you can combine a cumulation member with any measures and members in other linked dimensions, you only need to create the cumulation once. You can see this clearly in the report shown above. DeltaMaster combines the same two members, “non-cumulated” and “cumulated”, with different time references, value types (i.e. current, absolute variance to the previous year, relative variance to the previous year, absolute budget variance, relative budget variance) and different measures (e.g. revenues, discounts). The members also work if you switch to different months, even after you enter a new year.
- A cumulation member automatically “finds” the right starting period – even if the end period (i.e. current month) of the report changes after you refresh it or switch to a different year.
- You can use a cumulation member to switch entire reports or as an iteration in Small Multiples reports (see DeltaMaster clicks! 11/2010, section “Iteration type ‘member’”). This allows you to compare other report formats (e.g. Geo Analysis) as pivot tables in non-cumulated and cumulated views.
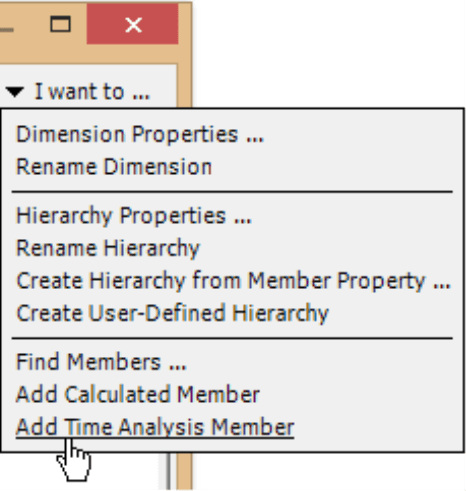
You add time analysis members in Pivotizer, Analyzer, and Miner modes by opening the Dimension Browser and selecting the respective entry from the I want to or the context menu. For a systematic introduction, please read DeltaMaster clicks! 08/2007.
In the Time Analysis Member Editor under the section Periods-to-date, you can select the Level that determines which member should start the cumulation. In other words, the cumulation member aggregates values that belong to the same parent member on the defined level. In most cases where you want to add up the months of the current year, that is the level “Year”: The monthly values of the same year are added up starting with the first month. This definition applies to all levels below defined one. The member in the example shown can create a sum of both quarters and months depending if the current member is a quarter or month. If you wish to create a cumulation of the current quarter (quarter to date), select “Quarter” as the level.
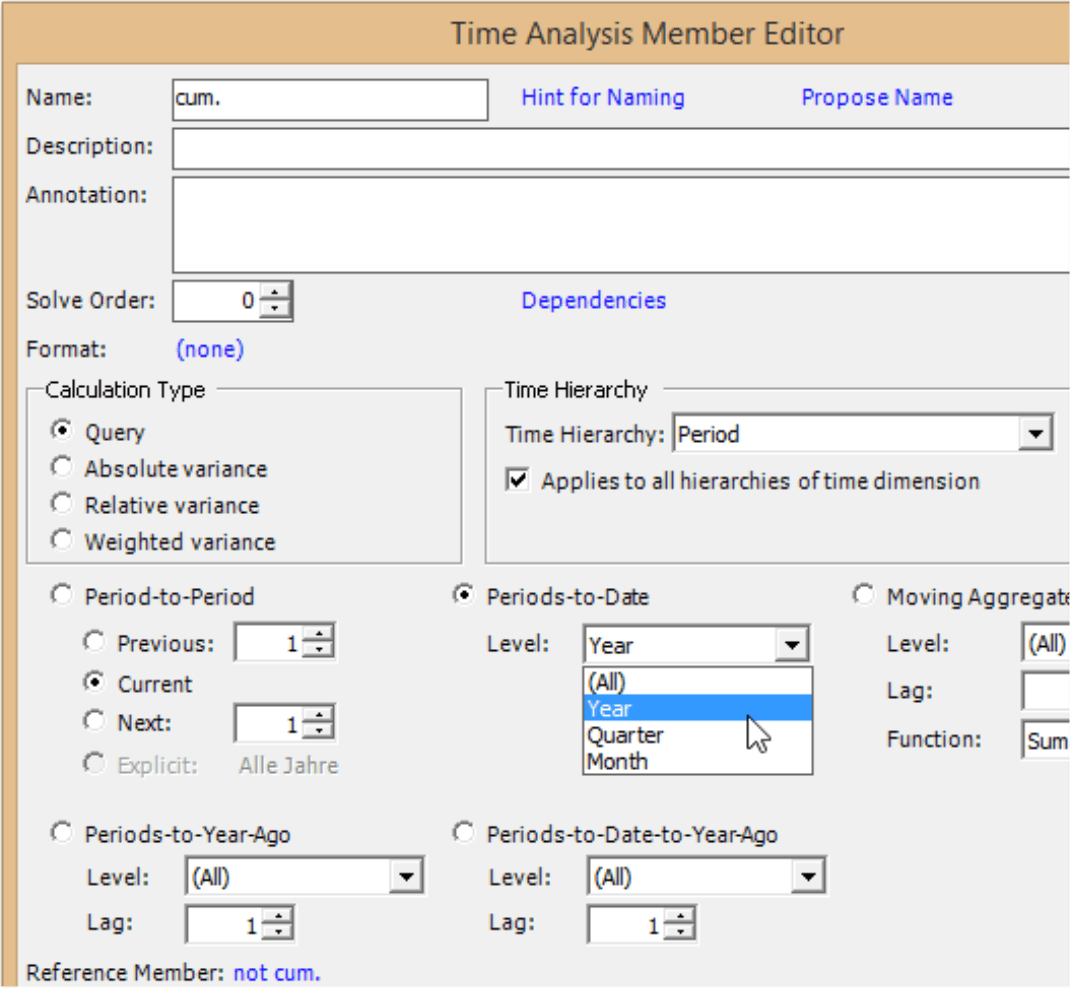
In the section Periods-to-Date-to-Year-Ago, you can combine this calculation with movement on the time axis. This allows you to query the respective values of the previous year as well as calculate variances (all Calculation Types are available; for Period-to-Period only Query). This option is necessary when only one dimension is available for cumulation and time analysis. If you have two dimensions, one for cumulation and one for time analysis (e.g. “Period View” or “Time Utility”), you would include the values from the previous year by combining both dimensions. For example, you would combine the member “Cumulated” with members such as “Previous Year” or “Previous Year Variance” in the Axis Definition of a pivot table.
Cumulation dimension
So which dimension should you use when creating a cumulation member? We recommend that you create a separate dimension solely for this purpose (and another one for time analysis). This dimension only needs one member: “non-cumulated”, which serves as a reference member for the cumulation member that you want to create in DeltaMaster.
If you create a data model using DeltaMaster Modeler, you do not need to worry about the cumulation dimension because it is a fixed component of the metadata model and DeltaMaster Modeler will generate it automatically including the reference member “non-cumulated”. You do not need to reserve a column in the relational data source for it.
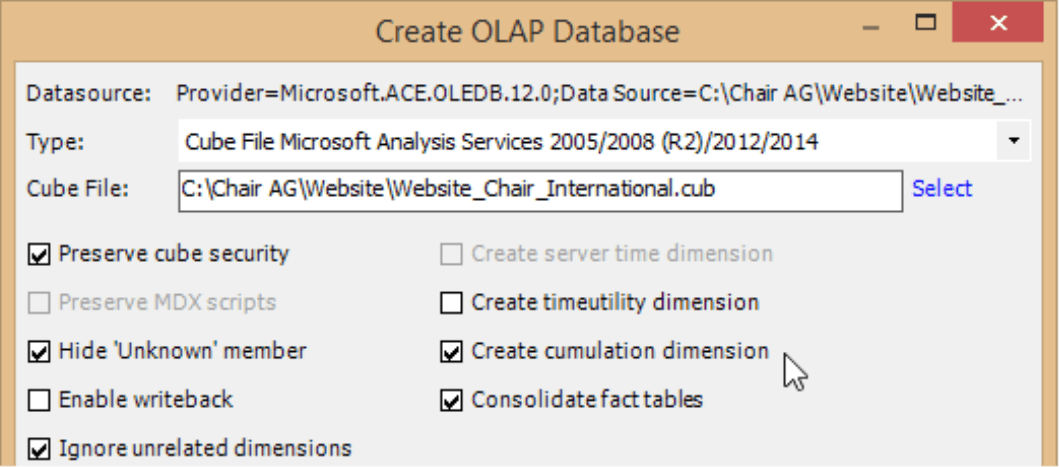
The case is also nearly that simple when you generate an OLAP Database using DeltaMaster CubeWizard (Model menu): The wizard offers you to create a cumulation dimension so that you do not need to create a separate column in the relational source. Then you add the cumulation member in DeltaMaster as described above.
Even if you have no influence on the data model, you can still use the cumulation logic of DeltaMaster. On principle, you can add a cumulation member to any other dimension. If the data model contains no cumulation dimension, a time analysis dimension (e.g. “Period View” or “Time Utility”) is a good place to store a cumulation member. As of DeltaMaster 5.6.3, you can even add one to the time dimension – with only minor limitations as described in DeltaMaster deltas! 5.6.3, feature #3.
Automation through Start Wizard
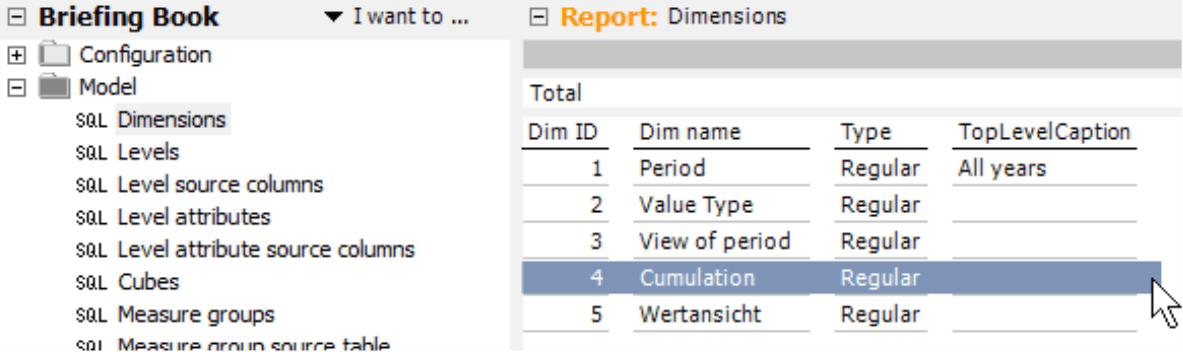
Creating a cumulation member is one of the first steps of every project. The Start Wizard of DeltaMaster can complete these tasks for you automatically (Model menu in Miner mode). DeltaMaster only needs to know where (i.e. in which dimension) you want to store the cumulation. You can enter this information on the Model tab. If DeltaMaster finds a dimension with a name such as “Cumulation”, it will automatically select it. Otherwise, you can select the desired dimension from a list containing all dimensions. Next, you define which member of this dimension should be used as the “non-cumulated” Reference Member. The first time you use this wizard, there is often only one member in this dimension anyway. You will also need to enter the Cumulation Member you wish to use. If none is available, DeltaMaster can create one. Otherwise, you can select a defined member from the database. If you choose to create one, DeltaMaster will try to reuse a suitable, existing cumulation member so that the Start Wizard can be used it again and again without generating duplicate calculated members.
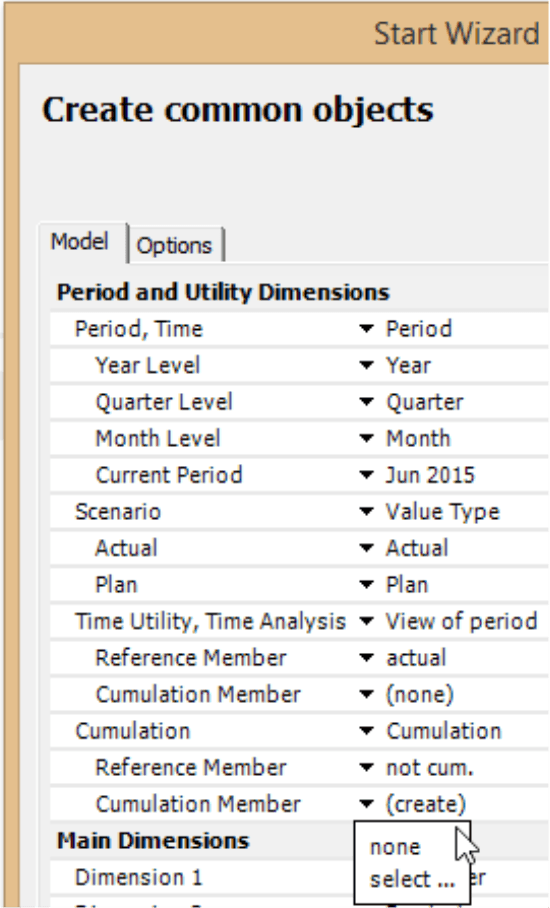
If you assign no dimension to the Cumulation, DeltaMaster will create the cumulation member in the time dimension as described above.
The Start Wizard will then generate all reports and the necessary model components.
Cumulation in analyses
Once you have defined a calculated member, you can use the cumulation as an additional attribute in reports or change the perspective of analyses and reports in the View. In some cases, cumulations are even inherent to the method.
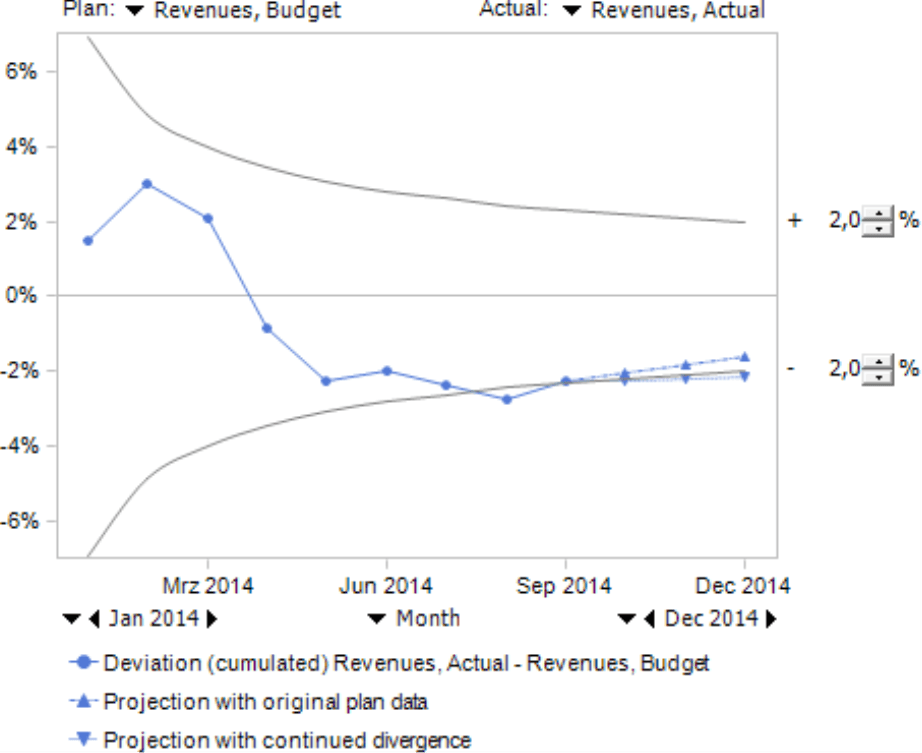
For example, DeltaMaster automatically works with cumulated values in a Trumpet Curve without having to create a cumulation member (or using one that already exists). This method is named after the shape of the resulting tolerance corridor, which is relatively wide at the beginning of the year (i.e. because there is still time to take counteractions) and gets narrower towards the end. By forecasting the cumulated variance to the year’s end, you can see how likely you will reach the year’s target based on the current development. For a detailed description of this method, please read DeltaMaster clicks! 05/2007.
The standard report “Way to go” also centers on cumulated variances. If these are negative, it even shows what you need to achieve in addition to obtain the planned yearly target. This report, which is generated by the Start Wizard, accesses a cumulation member. For more information, please read DeltaMaster clicks! 12/2014.
Since both the Trumpet Curve and “Way to go” reports have cumulations in them, you should always use them with a “not cumulated” setting – and not adjust them to include an additional cumulation. This primarily refers to the setting in the View window as well as the Axis Definition of pivot tables or the Measure Properties. You also need to keep this in mind for all other calculations based on a sum, for example, a rolling average (see DeltaMaster clicks! 07/2011) or user-defined measures that calculate an aggregation using MDX.
A Concentration Analysis also deals with cumulated values as illustrated with the class summary shown here on your right. These cumulations, however, refer to a consecutive addition from the largest member down to the current member. This, again, is based on the principle that the first member in the sum is constant and further ones are added successively. The cumulation, however, is based on a sorted list – and not time. As a result, you can combine a Concentration Analysis with a cumulated view.
![]()
Sparklines: Better without cumulations
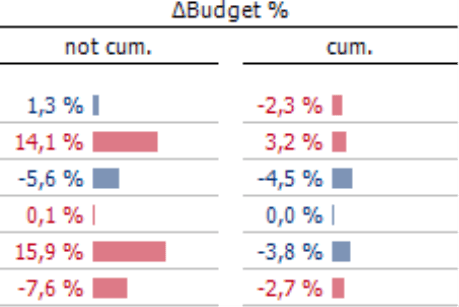
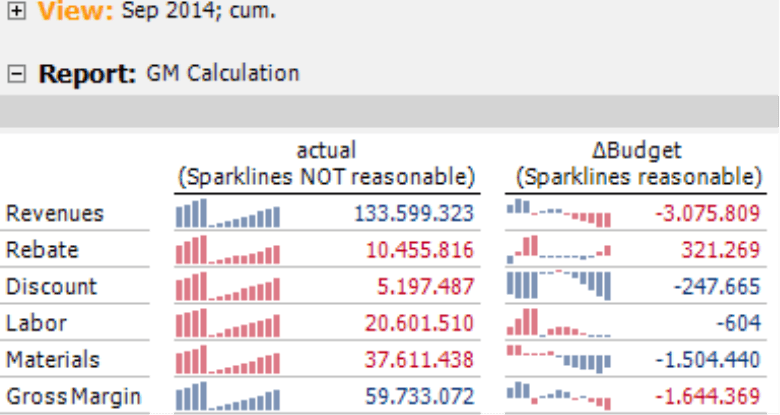
Visualizing cumulated values with sparklines only makes sense for variances – budget-actual variances in particular. Otherwise, they produce almost identical saw-tooth waves as shown in the left column of the screenshot on your right. This visualization is useless because it cannot differentiate the changes from period to period.
You may sometimes receive requests to label the sparkline with a cumulated value – for example, to display the monthly values as the columns of the sparkline as well as the sum as a number directly after the sparkline. We vehemently disagree! The standard rule for creating and reading sparklines says that the number is the label of the last column. This provides a solid base for the other columns so that you can interpret them. If you deviate from this rule, many readers will not realize this and there is a high risk for misunderstandings.
Therefore, non-cumulated values with sparklines belong in one column and the sums without sparklines belong in a separate, adjacent one as shown in the screenshot on your right.
These tips are explained in part three of our checklist for DeltaMaster applications (see DeltaMaster clicks! 11/2013).
Literally
The simple concept of a cumulation is rather cumbersome to put in writing – and the simpler case, the “non-cumulation” even more so. In fact, it will make the table start with a negation which is not really beautiful. Nevertheless, the combination of “non-cumulated/cumulated” is clear, compact, and consistent. That’s why the abbreviated version “not cum./cum.” is usually our first choice. If you want to avoid using negations, “current/cumulated” or “cur./cum.” is another option. The term “Year to date” or “YTD” is also widely used. Instead of negating this term, we recommend a term such as “current” (“cur.“) or “actual“ (“act.“). No matter which term you use, please use it consistently.
Abbreviating captions
Readers and editors will generally assume that the values are non-cumulated unless the report states something to the contrary. You can (and should) use this assumption to your advantage and hide the member “non-cumulated” in the View Description. This makes sense because you really do not need to say it every time. To hide it, open the Dimension Browser and deactivate the respective option in the context menu of that member (Pivotizer, Analyzer, or Miner mode). This shortens the labeling of the reports and improves their readability. This tip is also listed in part one of our checklist for DeltaMaster applications (DeltaMaster clicks! 09/2013).
No special requirements in the data model
In order for DeltaMaster to calculate the cumulation, there are a few simple “requirements” for the data model. In fact, you can view them more as a best practice.
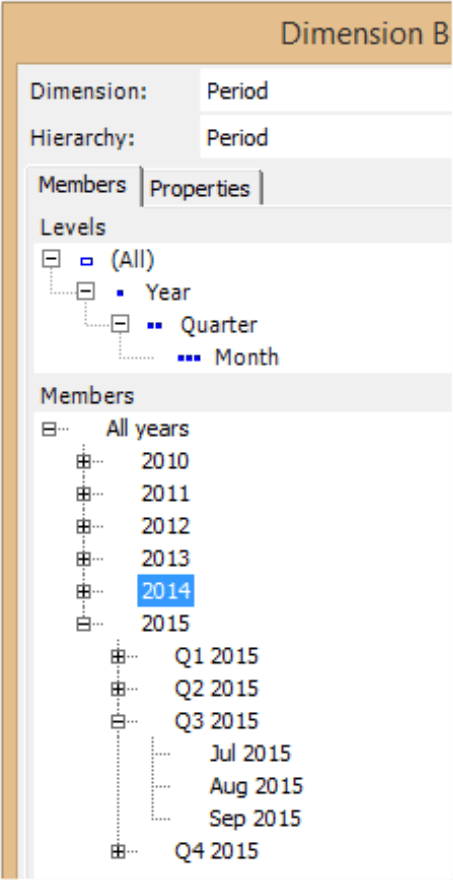
The structure of the time axis is important for the cumulation. The periods must be in one (and only one) hierarchy, for example, with months, quarters, and years so that DeltaMaster can find the period where the cumulation begins. The periods, therefore, should not be modelled consecutively for multiple years in a flat list, and the different time levels (e.g. months, quarters, years) should not exist as separate dimensions. Occasionally, you may come across data models that classify cumulated values as additional members below the non-cumulated members. These types of constructions are outdated, redundant, and often awkward to analyze. A cleaner way to model is to create a time dimension with separate dimensions for time analysis and cumulation as described above. If the time axis of your model looks like the one on your right, it is fine.
Questions? Comments?
Just contact your Bissantz team for more information.
