CiAgICA8IS0tIExpbmtlZEluIC0tPgogICAgPHNjcmlwdCB0eXBlPSJ0ZXh0L2phdmFzY3JpcHQiPgogICAgICAgIF9saW5rZWRpbl9wYXJ0bmVyX2lkID0gIjEyMzUwNzMiOwogICAgICAgIHdpbmRvdy5fbGlua2VkaW5fZGF0YV9wYXJ0bmVyX2lkcyA9IHdpbmRvdy5fbGlua2VkaW5fZGF0YV9wYXJ0bmVyX2lkcyB8fCBbXTsKICAgICAgICB3aW5kb3cuX2xpbmtlZGluX2RhdGFfcGFydG5lcl9pZHMucHVzaChfbGlua2VkaW5fcGFydG5lcl9pZCk7CiAgICA8L3NjcmlwdD48c2NyaXB0IHR5cGU9InRleHQvamF2YXNjcmlwdCI+CiAgICAgICAgKGZ1bmN0aW9uKCl7dmFyIHMgPSBkb2N1bWVudC5nZXRFbGVtZW50c0J5VGFnTmFtZSgic2NyaXB0IilbMF07CiAgICAgICAgICAgIHZhciBiID0gZG9jdW1lbnQuY3JlYXRlRWxlbWVudCgic2NyaXB0Iik7CiAgICAgICAgICAgIGIudHlwZSA9ICJ0ZXh0L2phdmFzY3JpcHQiO2IuYXN5bmMgPSB0cnVlOwogICAgICAgICAgICBiLnNyYyA9ICJodHRwczovL3NuYXAubGljZG4uY29tL2xpLmxtcy1hbmFseXRpY3MvaW5zaWdodC5taW4uanMiOwogICAgICAgICAgICBzLnBhcmVudE5vZGUuaW5zZXJ0QmVmb3JlKGIsIHMpO30pKCk7CiAgICA8L3NjcmlwdD4KICAgIDxub3NjcmlwdD4KICAgICAgICA8aW1nIGhlaWdodD0iMSIgd2lkdGg9IjEiIHN0eWxlPSJkaXNwbGF5Om5vbmU7IiBhbHQ9IiIgc3JjPSJodHRwczovL3B4LmFkcy5saW5rZWRpbi5jb20vY29sbGVjdC8/cGlkPTEyMzUwNzMmZm10PWdpZiIgLz4KICAgIDwvbm9zY3JpcHQ+CiAgICA8IS0tIEVuZCBMaW5rZWRJbiAtLT4KICAgIA==
Generic filters
Exact matches only
Search in title
Search in excerpt
Search in content

Stacked columns - why stacked?

Visualization often focuses on changes in shares which are compared to a total. Stacked column graphs which add up to 100% are a common chart type. But not for more than three shares at once. Readability is becoming too bad. Even three cause problems.
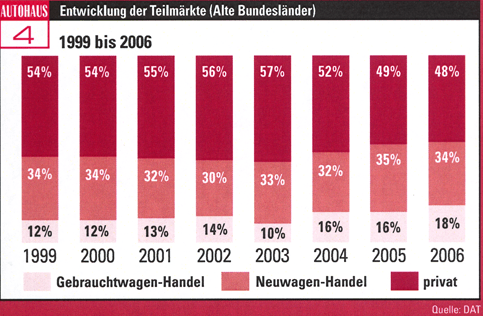
Stacked columns - three shares at once
Shares of channels for selling used cars: used car dealers, new car dealers and private

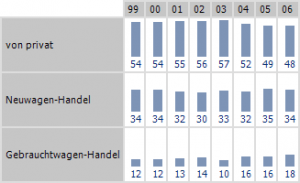
My eye has to grasp the height of the top-most columns from the top down. The columns in the middle are even worse. My eye keeps jumping up and down to grasp their height. The source of the problem: the top line symbolizes 100%. This is also plain to any reader, if I tell him beforehand that everything adds up to 100%. Thus, no need to focus the design of the graph on this convention.

Option 1: Columns in a Graphic Table
Option 2: Sparklines in a Graphic Table
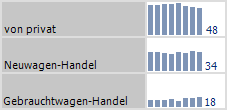
Sparklines in a Graphic Table instead of stacked columns