![]()
Greetings, fellow data analysts!
Companies spend a great deal of time and effort collecting, saving, preparing, and consolidating data – and, ultimately, making reports. But if a report is read and understood or even triggers a reaction doesn’t just have to do with the quality of the underlying data. The design plays a key role as well. When it comes to designing reports, DeltaMaster already answers many open questions and takes over a range of tasks, for example, through reasonable default settings, automatic formatting, and a carefully defined set of options. And for all of the tasks that you can’t automate (yet), we have set up recommendations and guidelines. We will present these to you as a series of checklists and explanations in a special edition of DeltaMaster clicks!:
Part 1: General Guidelines DeltaMaster clicks! 09/2013
Part 2: Pivot tables/graphical tables DeltaMaster clicks! 10/2013
Part 3: Sparklines, pivot Charts DeltaMaster clicks! 11/2013
Part 4: Nomenclature DeltaMaster clicks! 01/2014
You will see how you can make many improvements to your reports with very little work. Oftentimes, all you need to do is tweak a few settings to make your reports more attractive and easier to understand. The readers of your reports and audience of your presentations will surely thank you.
Best regards,
Your Bissantz & Company team
The first part of our series focuses on general guidelines with a very broad scope. These principles don’t just apply to individual reports; they benefit the entire application or analysis session. Best of all, you only need a few clicks to implement them. That’s what we call a good start!
| General guidelines
1) Use white style and horizontal separators 2) Cut down on the view description 3) Check the logic of algebraic signs 4) Check null members |
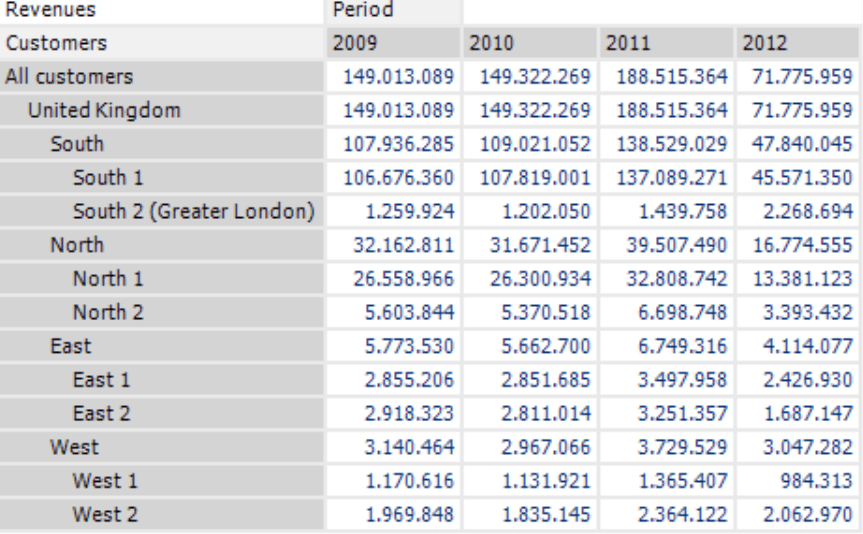
1) Use white style and horizontal separators
Most DeltaMaster users already display their reports using white style with horizontal separators.
 |
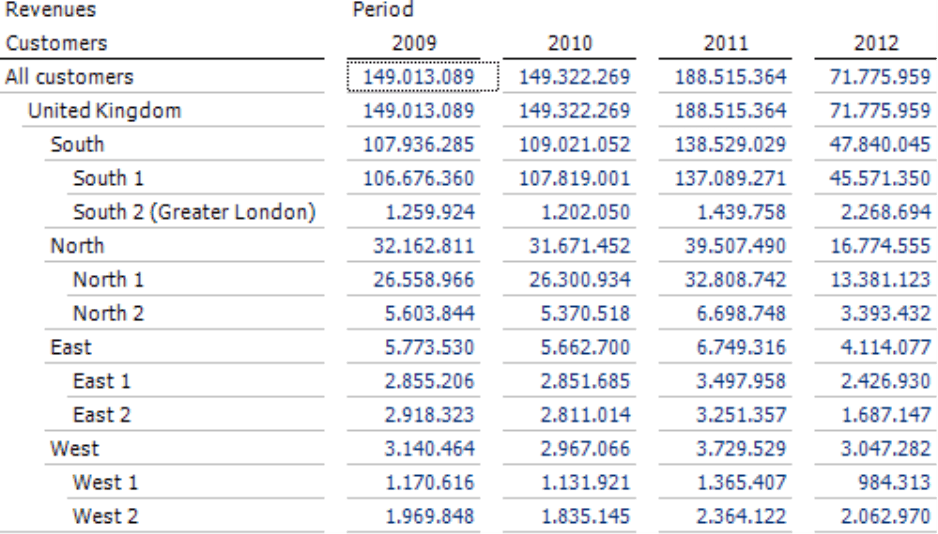 |
These design elements are void of grid lines and background colors. Black lines designate the column headers while a gap sets apart the columns. The gray separators direct the readers’ eyes from left to right across the rows to help them maintain an overview even in large tables. DeltaMaster displays the hierarchies on the row axis in lines with varying lengths. The presentation is clean, elegant, and objective. Some users (as well as we) even like to refer to it as “Bauhaus” style. We introduced white style in DeltaMaster 5.3.6, in other words, back in 2008.
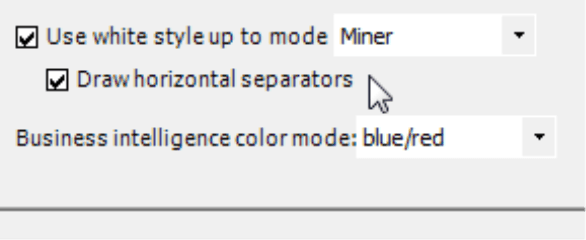
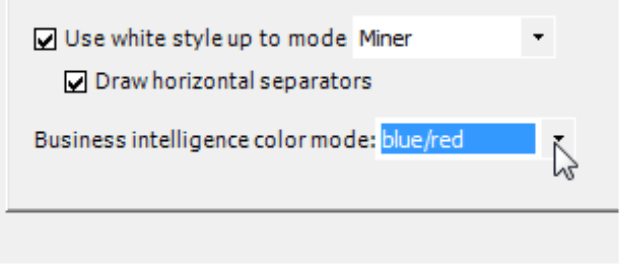
You can activate white style and horizontal separators in the Options (Extras menu) on the Presentation tab. We recommend using this type of display up to Miner mode.
DeltaMaster will automatically configure all new analysis models using these design elements. This setting applies to the current analysis session (DAS file) or application.
2) Cut down on the view description
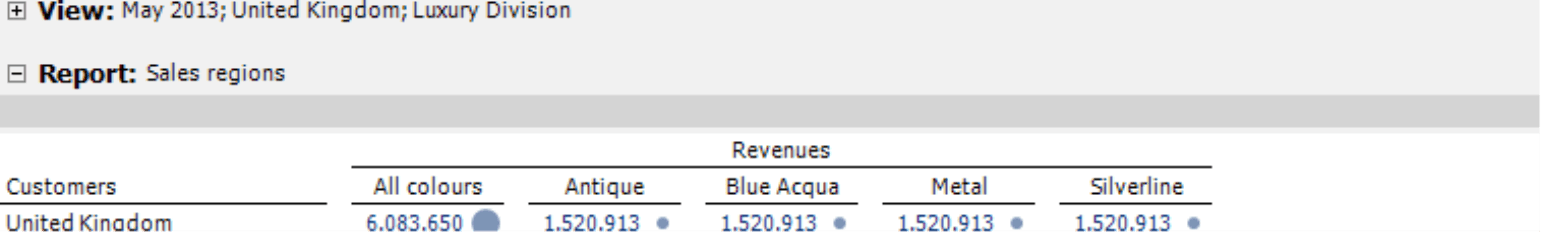
The view description, which summarizes the current member selection, has a surprisingly strong influence on the perceived appearance of an application. If you are working in models with many dimensions and in reports with many selected members, this description can become so long, that you might not be able to immediately find key information or even want to read it in the first place. Although the description shouldn’t leave out any important information, it still needs to stay clear so that the reader can easily see what the report is about and what it is referring to. Yet on the other hand, the description can also be obstructive at times when all of the selected attributes are listed.
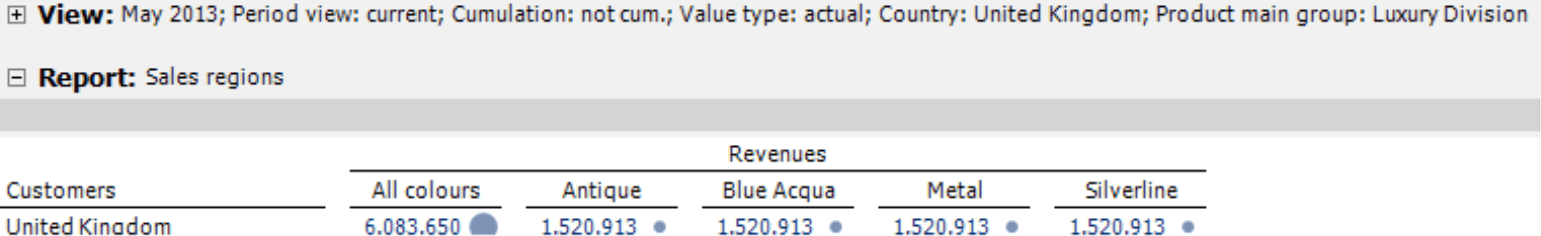
The screenshots below show the same table two different times. The top table shows the complete View, which is rather complicated to read. The bottom one, however, is clear and easy to understand: “May 2013; United Kingdom; Luxury Division”. We have made this improvement by changing two settings.
 |
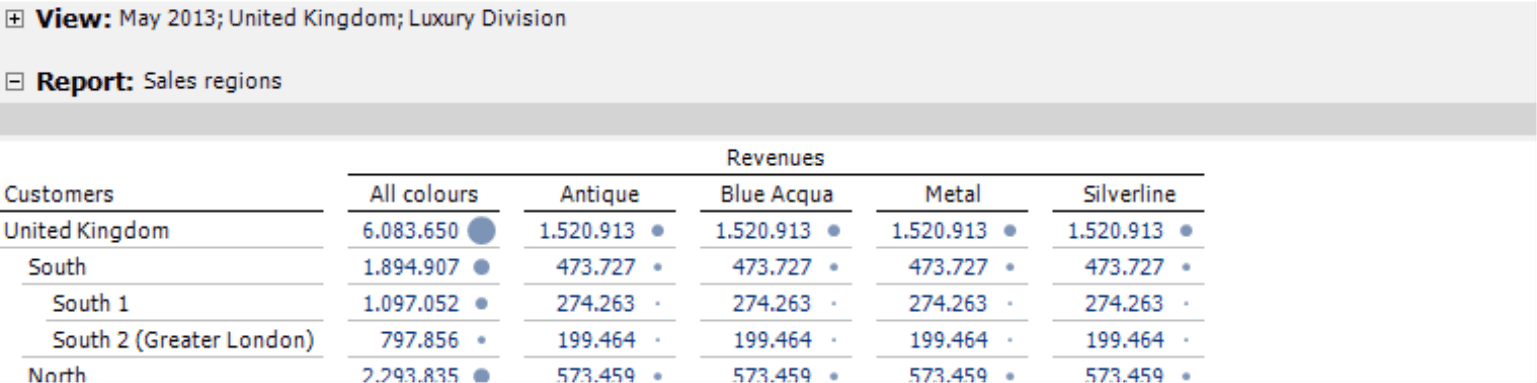 |
The first way you can condense the view affects the names of hierarchy levels. Oftentimes, the member’s name clearly states that it belongs to a certain dimension and level. Since everyone knows that May is a month, for example, the entry “Month: May 2013” would be overly specific. Just “May 2013” suffices. In the time dimension, you can generalize that; therefore, DeltaMaster completely omits the level names automatically. Similarly, you can remove the level names in many other dimensions to shorten the view description. This is especially the case when the levels have non-descriptive or technical names such as “Level02” or “ProdHier03”.
The following screenshots show the same View – before we had applied this option to tidy up the descriptions (top) and after (bottom). The levels “Period view“, “Cumulation”, “Value type”, “Country”, and “Product main group” have been omitted. And as you can see in the bottom screenshot, you don’t really miss them either.
 |
 |
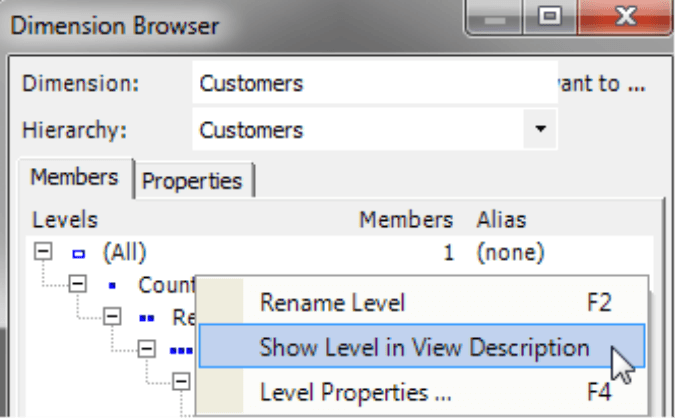
To help you gauge which level names you can hide, check if your readers can still understand the term to the right of the colon if the name to left of it were missing. If that is the case, you can probably omit this name without any problems – and that goes like this:
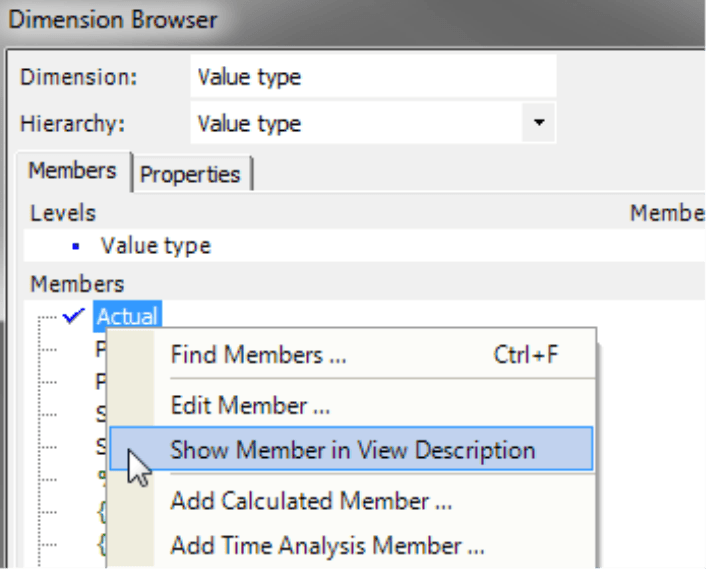
If you do not want DeltaMaster to Show [a] Level in [the] View Description, open the Dimension Browser and deactivate the respective option in the context menu of the level.
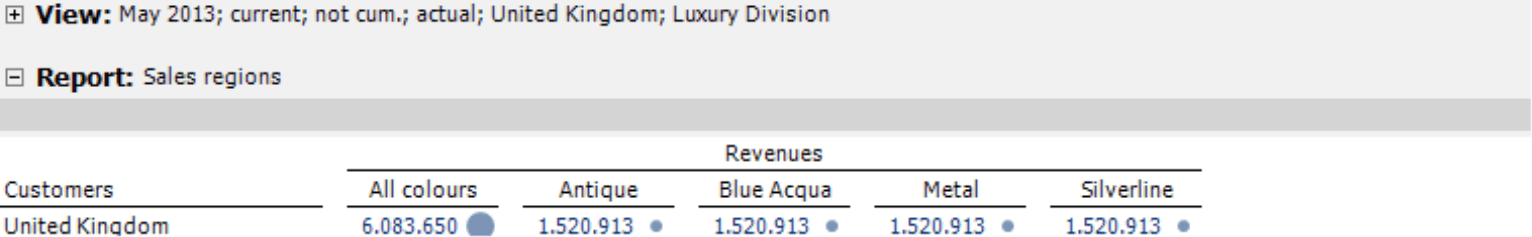
The second option to trim the view description affects individual members that readers view as being self-evident. For example, you should always expect that a report is displaying “actual” if nothing to the contrary is explicitly stated. “Budget”, “forecast”, or “latest estimate” need to be specified – “actual”, however, does not. There are also other dimensions that contain standard members such as “current” for Period View, “Not cumulated” for Cumulation, or “1:1” for Scale.
|
 |
The screenshots above show the same View – before we had applied the option to tidy up the descriptions (top) and after (bottom). The members “current”, “not cum.”, and “actual” have been removed. And as you can see in the bottom screenshot, you don’t really miss them either.
Aside from the standard dimensions, many applications contain other attributes that describe a standard scenario that normally doesn’t need any description (i.e. only in special cases). Hiding these attributes from the View in standard cases can help make the description clearer and easier to understand.
You can hide the members in the Dimension Browser. In the context menu of the members, you can define if DeltaMaster should Show [this] Member in View Description or not. To hide members from the view description, deactivate this option. Hiding a member in this manner will only become effective if the respective member is the only one selected in the dimension. If you have selected multiple members such as “actual” and “budget”, DeltaMaster will always display all members.
Both of the settings described above apply to the current analysis session (DAS file) or application and only for the view description (not the presentation in analysis and reports). For more information on building or editing view descriptions, please read DeltaMaster clicks! 10/2008.
3) Check the logic of the algebraic signs
Business Intelligence colors are a fundamental concept in DeltaMaster. All values are automatically colored based on what they mean for your business – regardless of the algebraic sign, accounting rules, and so on. Blue is good; red is bad. Understanding reports doesn’t get any easier than that. A rise in sales and reduction in costs are both blue while a drop in sales and increase in costs are both red. Blue is good; red is bad. Period.
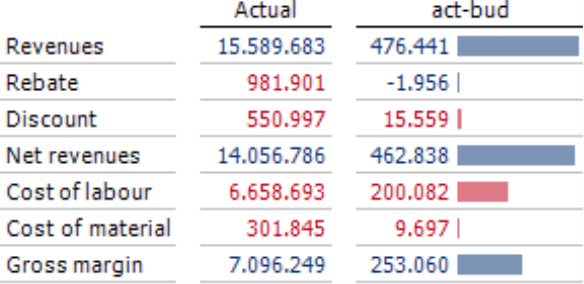
To ensure that this logic works, you must check that the BI factor is set correctly in the analysis session or application. For the most important measures, the BI factor has probably already been defined during the system implementation. If different users have added further measures over time, however, they may have forgotten about the BI factor. Accordingly, it pays to check from time to time if the BI colors are still correct.
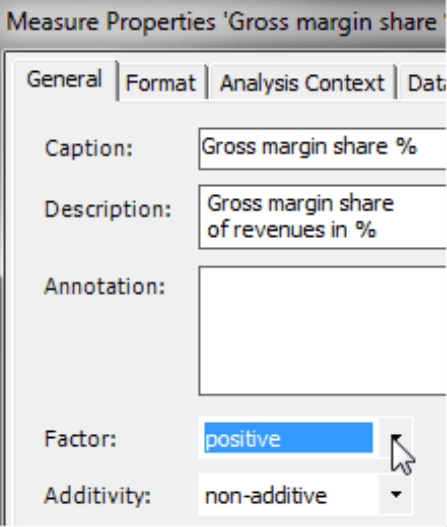
If necessary, you can edit the factor in the Measure Properties on the General tab:
- A positive factor means that this measure has a positive effect on your business – the higher, the better. For example: revenues, units sold, margin, market percentage, capacity utilization.
- A negative factor means that this measure has a negative effect on the business – the lower, the better. You could, for example allocate a negative factor to all cost types (provided that they are posted as positive numbers).
If needed, experienced report editors can also switch the factor directly in the pivot table by holding the Alt key and right clicking the name of the measure.
It is also possible to set the BI factor from a member property. This option is intended for account dimensions such as the items of a profit and loss statement. For more information on this topic, please read DeltaMaster clicks! 01/2010.
One consideration may be the color mode: You can choose from two color combinations: blue/red and green/red (Extras menu, Options, Presentation tab, Business intelligence color mode). We recommend blue/red. Although green/red is conventionally used elsewhere, this color combination is difficult to differentiate and is very strenuous on the eyes.
4) Check null members
In many data models, you may find members like “unknown”, “not assigned”, “N/A“, “missing” or “undefined”. These are pooled items that cannot be allocated elsewhere. If larger amounts accrue here, this could be a sign of errors or gaps in the data transfer or the business process as whole. In a well organized system, everything can be allocated correctly and you do not need these types of members. This saves space and makes the report easier to understand. The easiest way to exclude these members is to declare them as null members. This works in one of two ways:
-
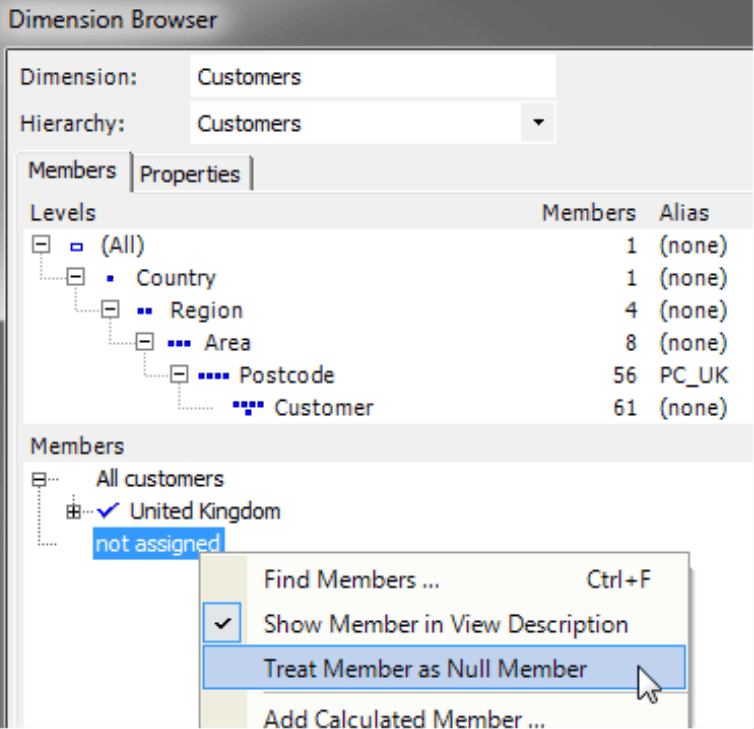
- To Treat [individual] MembersasNull Members, open the Dimension Browser and activate the respective option in the context menu of the member. DeltaMaster will only display this option when the option to exclude null members is activated as described below. Null members are displayed in the Dimension Browser in gray type.
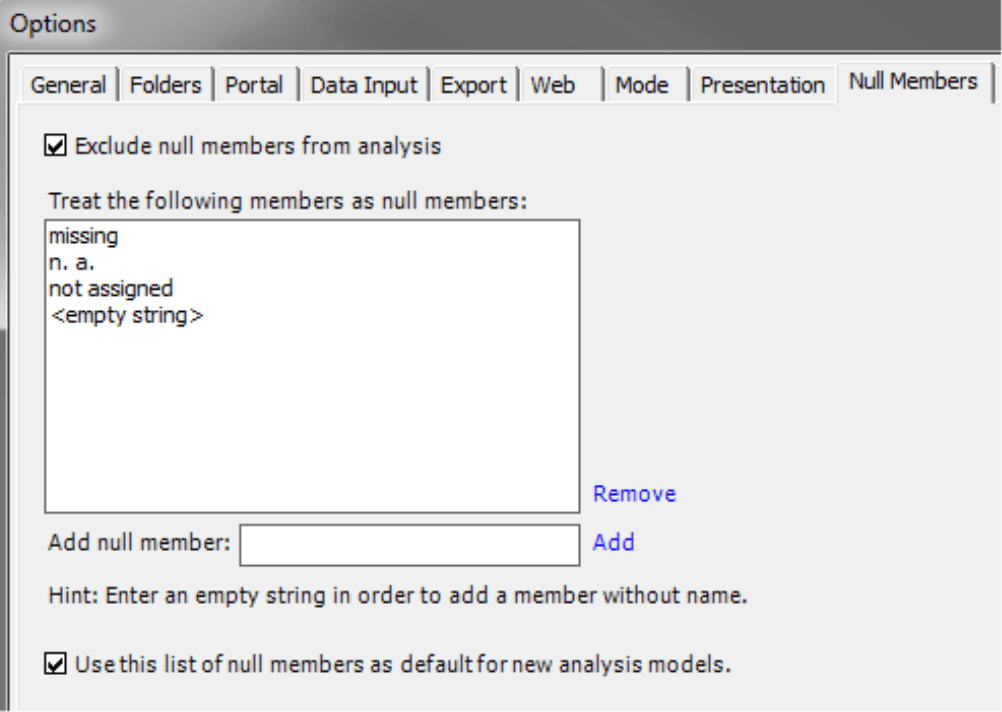
- Depending on the database and model setup, null members can also appear in larger quantities. Sometimes, each hierarchy or even each group of members has these types of remnants. In this case, you may want to exclude all null members at once instead of searching and selecting each one individually in the Dimension Browser. In the Options (Extras menu) on the Null Members tab, there is a data entry field that allows you to do just that. Here you can enter the names of the respective members (e.g. “missing”, “n.a.”, or even an empty character string) and Add it to the list. You can also opt to use this as the Default setting for new analysis models.
Excluding Null Members has the same effect as an additional, global limitation of the View. From that point on, DeltaMaster will ignore the null members in cockpits, reports, and analytic results and not include them in calculations as well (unless, of course, you have explicitly selected them in a pivot table. For more information on null members, please read DeltaMaster clicks! 06/2010.
If you take these general guidelines to heart, you will have already done a great deal to improve your DeltaMaster applications. We’ll continue in the next edition with tips for working with pivot tables.
Questions? Comments?
Just contact your Bissantz team for more information.
