![]()
Greetings, fellow data analysts!
In a three-part series from April through June, we presented the output formats and channels that you can use to automatically generate, update, assemble, and distribute reports. Many of you responded with inquiries about Publisher or ReportServer, as the module is called in DeltaMaster 5. Some of the questions are easy to answer. For example: Isn’t this type of automation, a “server”, something for large applications with many consumers and frequent updates? No! Automation has its benefits even when you only have to export or send a single briefing book, but more than one time and to more than one person. Here you can already find ways to boost efficiency, and DeltaMaster can help. Another question was: “Does it work with every report or do you have to take certain things into consideration when you initially build it?” The short answer, generally speaking, is yes. The detailed response on how to design easy-to-publish reports is the subject of this edition of clicks!. If you embrace these ideas, you will reap the benefits – both in interactive, dynamic reporting and automated, static reporting – and achieve further gains in efficiency.
Best regards,
Your Bissantz & Company team
How well reports can be automatically updated and adapted to different consumers and content all depends on the way they are designed. Yet there are different ways to achieve an objective and to build a report. It also makes a difference if you only need the report once (and never again) or intend to reuse it, vary it, or build a template from it. In these cases, the report logic plays an important role.
Input, process, output
Before we make recommendations for designing easy-to-publish reports, let’s first take a look at the way Publisher (DeltaMaster 6) and ReportServer (DeltaMaster 5) work. Roughly speaking, we can break this down into the IPO model:
- Input: DeltaMaster opens the report source (an application in the repository or an analysis session in a DAS or DM2GO file) and connects to the analytic database (the data warehouse).
- Process: The reports are recalculated from the report source. DeltaMaster runs all necessary database queries so that the reports reflect the current status of the data. Before it runs these queries, you can modify the reports with three tools:
- Using the Report Update, DeltaMaster changes the View (i.e. filters) in all reports and sets the selected members in each listed dimension. Let’s say, for example, that you need to change the period to July 2016. A typical use case: The monthly balance is completed and the cube data has been recently processed. Now all you need to do is to switch all reports to the new month. The report update has no direct effect on the output as in step 3.
![]()
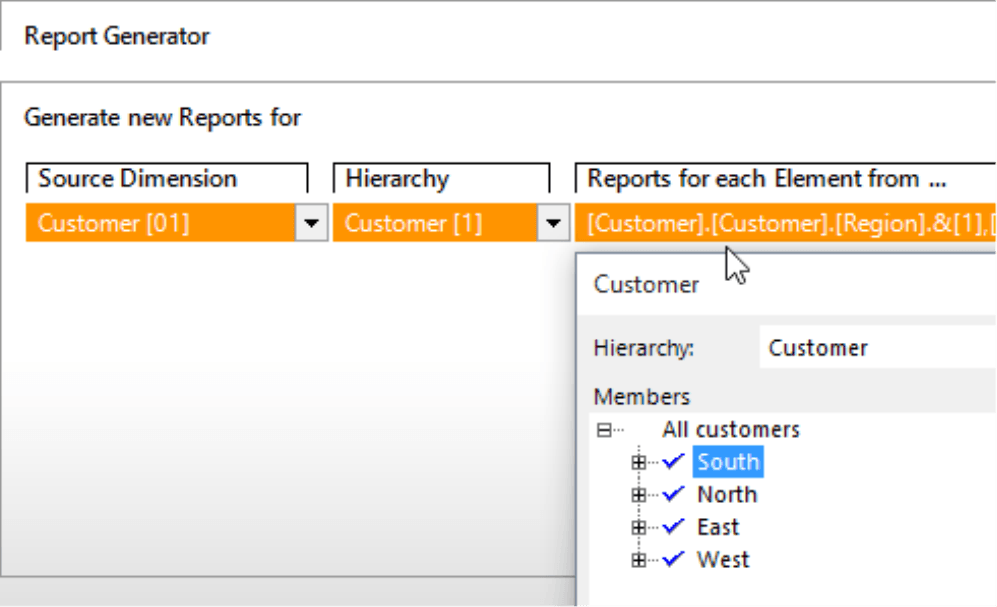
- In the Report Generator, you can define several members that are processed in a loop (iteration) to change the View (filters) repeatedly. The report generator has a direct effect on the output in step 3. It generates a separate output for each member of the loop, for example, an individual briefing book sent by email to each sales representative, cost center manager, and so on. Let’s say, for example, that the members “North”, “South”, “East”, and “West” are selected in the customer dimension. DeltaMaster will then switch all reports from the report source to the member “North”, calculate them with this filter, generate the output (e.g. as an HTML file), and distribute them (e.g. as an email). The next member in line (e.g. “South”) will follow. DeltaMaster again switches the filter in all reports, recalculates them, generates the output file(s), and sends the result(s). This process continues with “East” followed by “West”.
- The Briefing Book Generator also processes several members in a loop. Instead of more output files, however, it generates new folders and reports within the briefing book from the defined application or analysis file. You can access this tool, which we introduced in DeltaMaster clicks! 06/2006, in the Settings of a job. It has no direct effect on the output in step 3. The briefing book generator is rarely used and reserved for special tasks – after all, the goal is usually to create just a few, interactive reports instead of many static reports in the briefing book. As a result, we will not cover this tool in more detail on the following pages.
In the Report Folders window, you can define on which reports you want to use the tools – only the reports in the selected Report Folders, possibly including sub-folders or, if nothing is selected, all reports in the report source. For all three tools, the respective modifications only affect the further processing through the Publisher (i.e. not the saved report source).
![]()
- Output: DeltaMaster outputs the reports in the set report format through the defined distribution type (e.g. PDF file saved to the file server, HTML file sent as an email, or a new DeltaMaster application in the repository). For more information on report formats and distribution types, please read DeltaMaster clicks! 04/2016, 05/2016, and 06/2016. In the case of exception reporting, not all processed reports are included in the output: You can define the conditions when a report should be included in the output or not. For more information on exception reporting, please read DeltaMaster clicks! 11/2008.
In short, the Report Update changes the View within the briefing book without generating additional output. The Report Generator changes the View in the briefing book in a loop and generates a new output for each new View. Like most users, you will probably use a combination of the two. For example, you set the new month in all reports (with the Report Update) before you generate and save or send the briefing book for each individual cost center or office (with the Report Generator).
The View is key
What this all tells us is: The Publisher primarily changes the View. That is its own major service. For most other tasks, the Publisher relies on the functionality of the interactive DeltaMaster program, for example, querying the database, calculating reports, or generating export files. DeltaMaster does those things anyway at the user’s request. The Publisher can call up these functions and use them as well. As value added, it automatically changes the View.
And that is the secret behind reports that are easy to customize and automatically update: You have to do it through the View – and only the View.
Reports should be dynamic
If you want an easy-to-publish report, you need to design it so that the automatic variations only depend on the View (in other words, from filters as you would set them in the Filter Bar or the View window) and require no structural changes. To put it in hands-on terms, if a report recipient in Presentation Mode of DeltaMaster 6 or in Viewer mode of DeltaMaster 5 can switch the briefing book to create a custom View, Publisher can do it as well. You could also say whatever is good for dynamic, interactive reporting is also good for static, automated reporting. It’s that simple: If you want to mass produce a series of good, static reports, all you need is a good dynamic report.
We will use two examples to show how you can generate dynamic reports. Both involve Graphical Tables (Pivot Tables). The relation of the Axis Definition and the View plays an important role.
Example 1: Comparison to the previous month
This very simple report compares a given month to the three months prior (e.g. July to April, May, and June). You can do this in different ways.
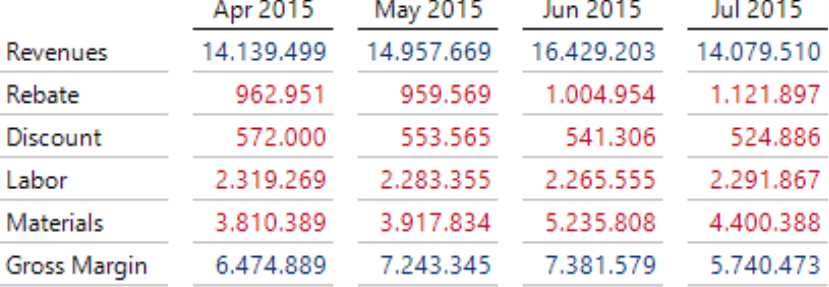
As a first attempt, you might generate the report by placing the months in the View and referencing them as a level selection in the Axis Definition. You can certainly do it that way, but there are better alternatives if you want to publish it. If you would use this report in the following month and place four new months in the report update, you would receive the desired result in this particular report. However, you would have to set this View for all other reports in the report source. In many other reports, this could cause undesirable results, for example, a calculation of the sum of the four months.
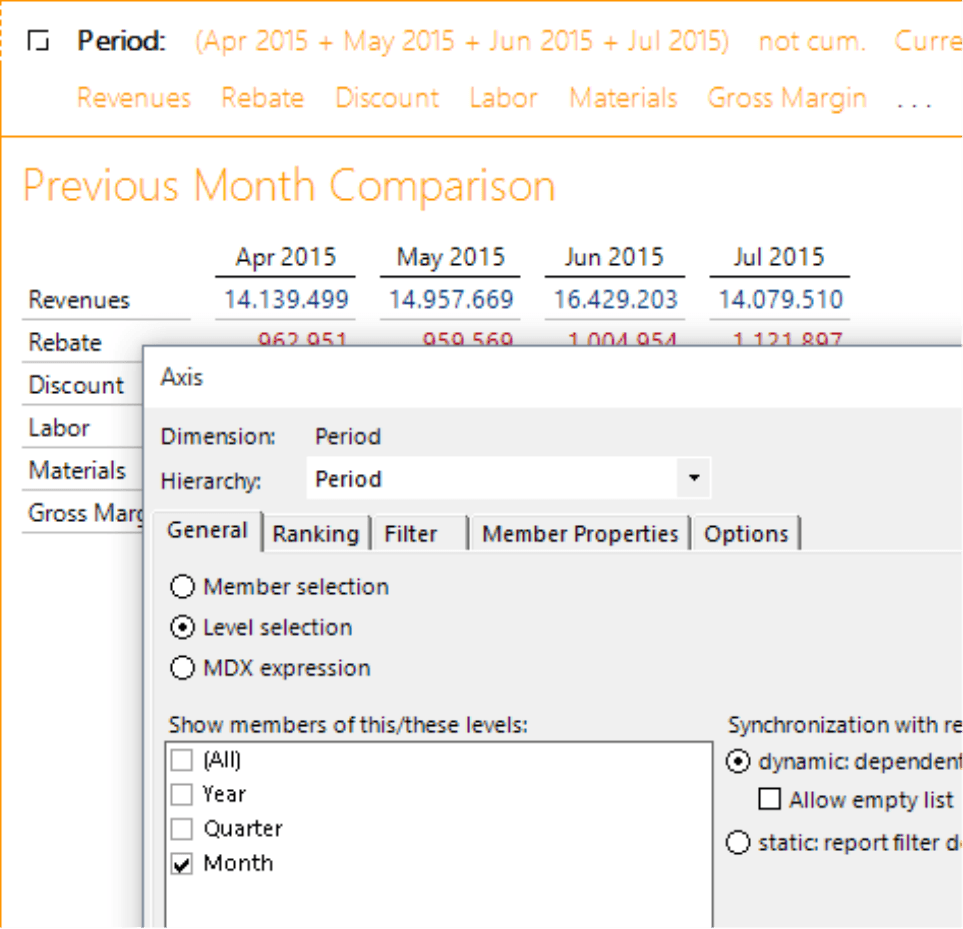
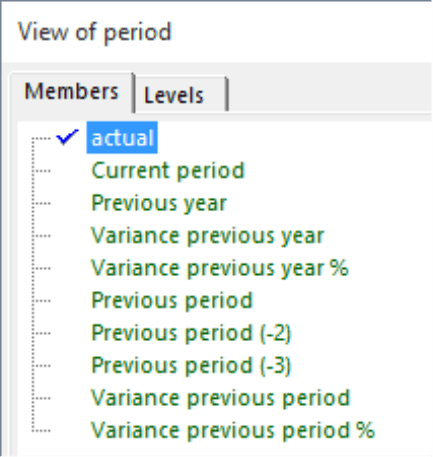
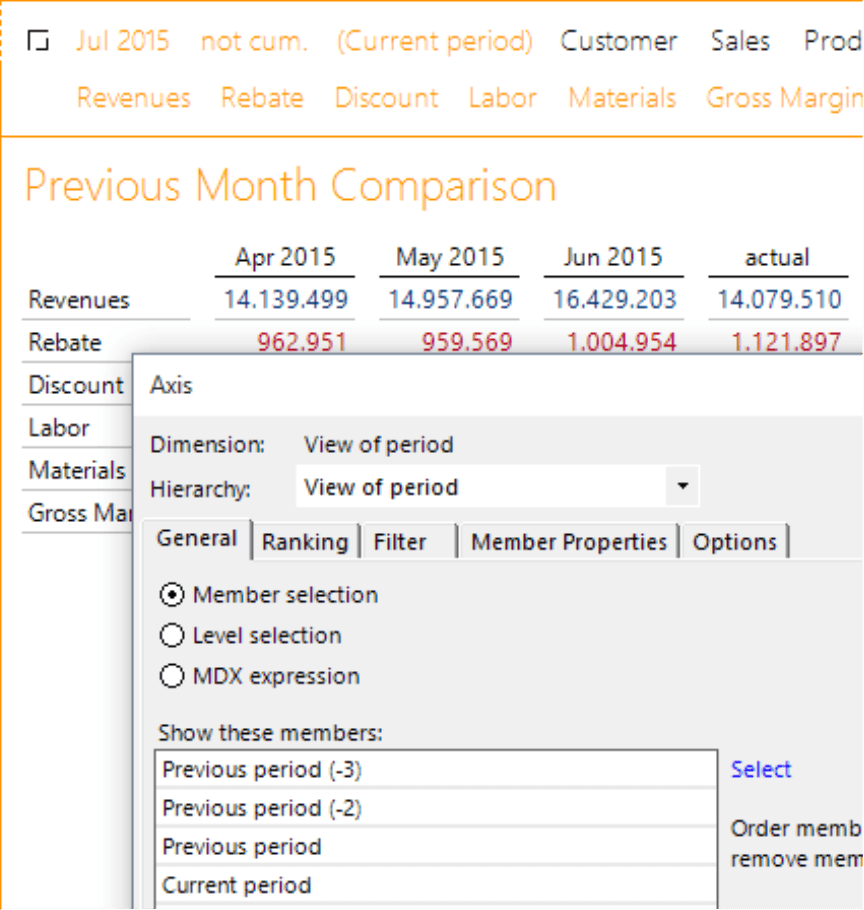
The better approach is to describe the reporting task abstractly. After all, the report should actually display the current month and the three months prior regardless what the current month is – and not simply April, May, June, and July. To do this in DeltaMaster, you could use time analysis members, which are usually designed as an auxiliary time utility dimension. The members “Current” and “Previous Period” are frequently already available. That means that you would only need to add members for the two months prior to it: “Previous Period (-2)” and “Previous Period (-3)”.
A report based on this kind of definition is only dependent on a single filter. The “current month” refers to the month set in the View: July 2015. The other three do that as well, with the respective offset. This creates a rolling calculation that depends on a single filter member and works well, both as an interactive chart or when Publishing. That is both elegant and efficient!
For more information on time analysis members, please read DeltaMaster clicks! 08/2007. If no separate utility dimension is available, you can add them directly to the time dimension (see DeltaMaster deltas! 5.6.3, feature #3). Experienced report editors make it even easier with MDX. The expression “<view>. lag (3):<view>” in the time dimension creates the same result with the same column structure as the member selection in the Period View.
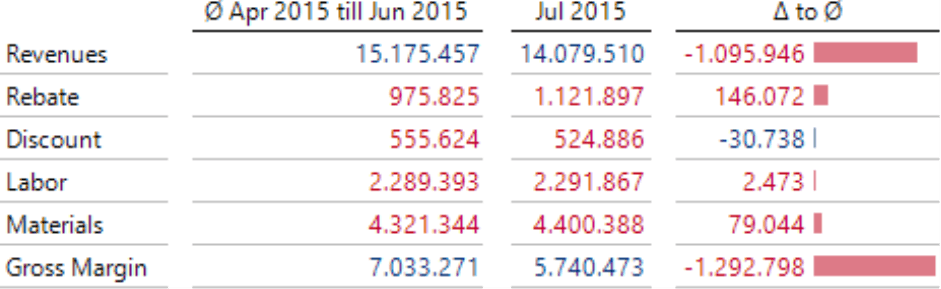
Please note that this is just an example. In a live application, we would recommend placing more than just a few months next to each other to enable comparisons. The example above would not suffice to send a signal or trigger actions. A more interesting option would be to calculate the three-month average and show the variance of the current month to this average. That sends a clear message! Please read DeltaMaster clicks! 07/2011 for step-by-step instructions.
Example 2: Reports per sales region
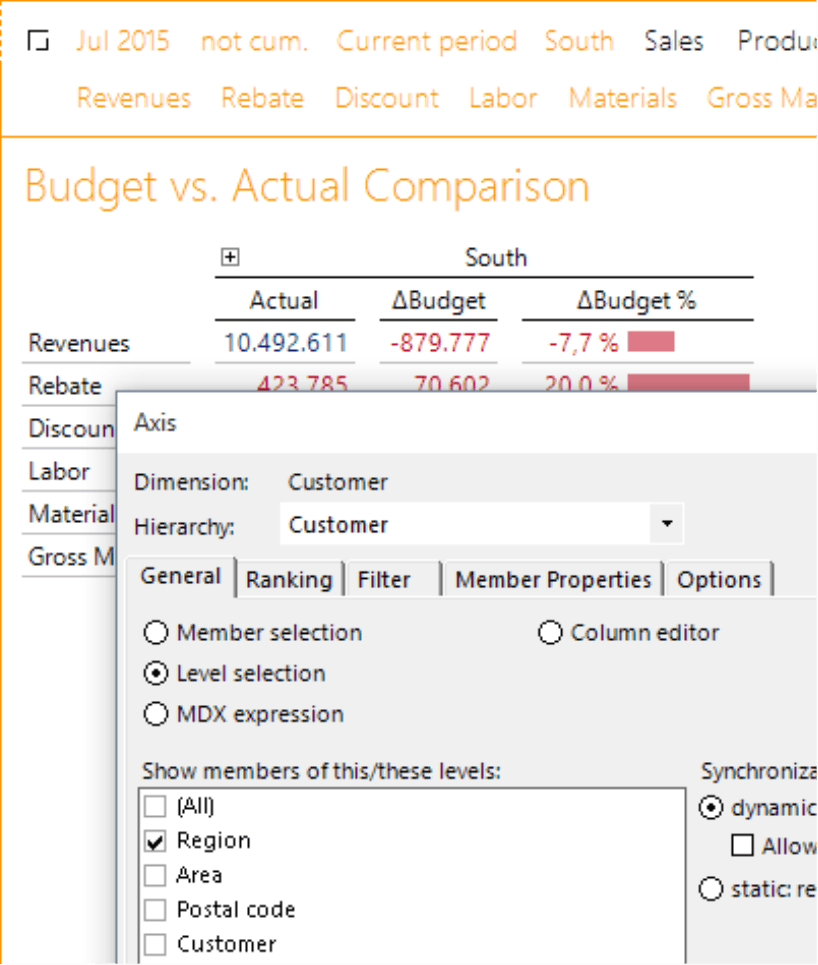
In this example, let’s create a simple budget-actual comparison for different sales regions.
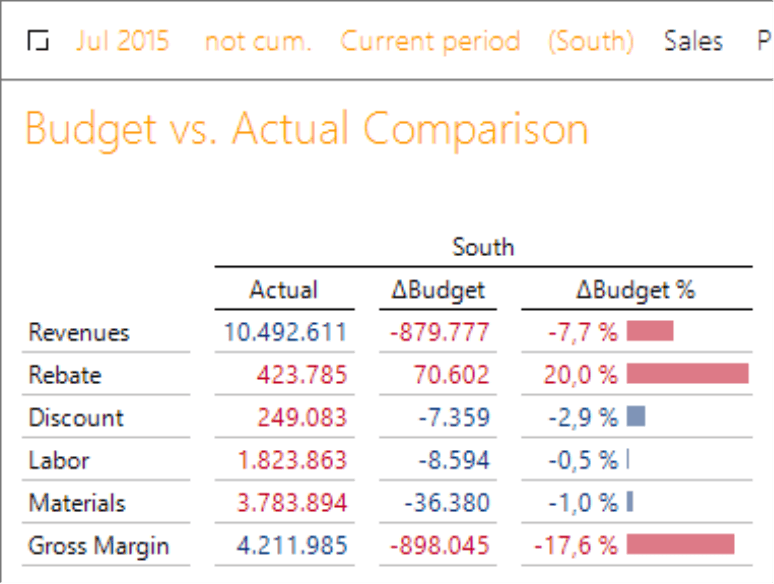
The report editor, in this case, decided to set the region as a member selection in the Axis Definition. You could already see this in the previous screenshot: The region “South” is listed in parentheses, which means that the filter is set in the current report but not used. The selection in the axis definition overrides the filter in the report. The Publisher cannot access a member that is set as a member selection in the Axis Definition. That is the nature of the member selection in the Axis Definition: Whatever is set here is valid – regardless of the View and, therefore, also regardless of Report Update and Report Generator.
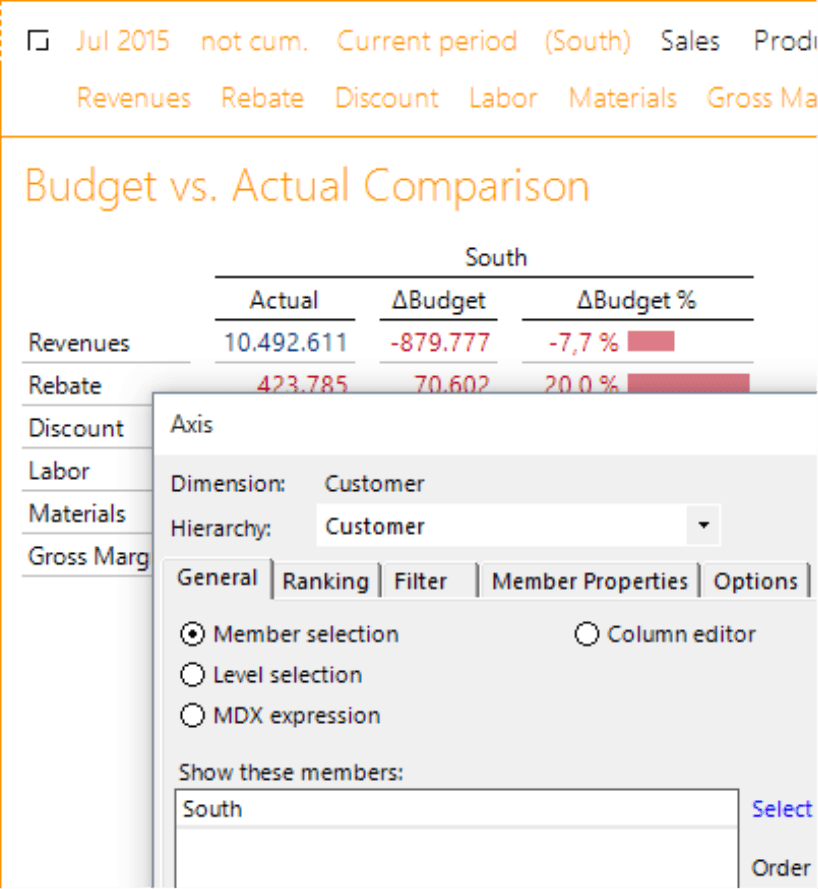
The solution is clear: You need to design the report so that the Axis Definition only contains the attributes that cannot be changed, for example, the column structure with time comparisons or variances. When working with dimensions such as customers, products, colors, offices, or cost centers, you should select them in the View and not the axis as a general rule.
With this definition, you can automatically iterate this report over the regions with no further problems.
Minimal requirements, maximum effect
The Publisher is a notably thin component that is included in the installation files and scope of delivery of DeltaMaster 6. You can install the ReportServer of DeltaMaster 5 as an added option or copy a few files (less than 1 MB) into the DeltaMaster program directory from a zip archive. Storage requirements are minimal and getting started is simple since key functions for report recalculations and exports are already contained in DeltaMaster. These functions are simply automated in DeltaMaster when pulishing.
If you want to initially test Publisher/ReportServer, you can give your IT the all-clear that ReportServer is called “server” just because it is a highly servile tool and works automatically (instead of interactively). It doesn’t need a server operating system, separate computer/user, or special system services. You can use it as an additional component for automation on any PC or laptop of someone who uses DeltaMaster interactively. The only thing you have to keep in mind are the user permissions. If you want to publish applications from the repository with DeltaMaster 6, you will need to assign the roles “Define Report Distribution” and/or “Execute Report Distribution” to these applications. Please note that these are two separate roles (one does not include the other). Frequently, both roles are assigned to a given user. No special license for DeltaMaster 6 is necessary – the publishing functionality is already included in the REPORTING licenses. DeltaMaster 5 requires separate licenses for ReportServer.
If you work with very large applications, you can run jobs on a separate computer. We refer to this as “ReportService” in contrast to “ReportServer”. Please read DeltaMaster deltas! 5.4.2, feature #27 for more information.
