![]()
Greetings, fellow data analysts!
We have often spoken on behalf of using paper as a medium for management information because it has such a wonderfully high resolution. Screens and projectors simply cannot compete – but they, unlike paper, are suitable for interactive applications, which can immediately show what we want to see whenever and wherever we need it. Tooltips are just one example of interactive features. If you mouse over regions of a map – or sparklines, trend arrows, and scales in graphic tables or even circles, bars, or columns in charts, DeltaMaster will display the respective values, descriptions, and other important information in a small box next to the mouse pointer. This way, you can directly access additional information from individual report objects without permanently showing them (and having them take up space from the start). This makes it easy to not only analyze and understand but also to present and discuss your data. Since interactivity is one of DeltaMaster’s strengths, you can access tooltips – partially with explanations, advice on the proper interpretation, and the results of additional calculations – in many different areas of the application. You’ll find more tips on tooltips in this edition of clicks!.
Best regards,
Your Bissantz & Company team
Every computer user knows tooltips – the small, typically yellow windows that appear next to your mouse pointer when you hover over something on your computer screen. Microsoft calls them QuickInfos, others call them info windows, balloon help, or balloon tips – and some users simply call them bubbles or flags. The nice thing about tooltips is that they don’t take up any space on your computer screen because they are only displayed when needed. They don’t need to be squished among the other elements because they are placed on top of them, and they disappear by themselves when you move the mouse pointer away from the object. Tooltips are a good example of the possibilities that interactive user interfaces offer, and DeltaMaster makes extensive use of them throughout the software.
You can divide DeltaMaster tooltips in three different categories based on the subject of the additional information.
- Tooltips that refer to the data in cockpits, analyses, and reports and enhance their content with additional information or explanations (e.g. the exact value and period in sparkline columns)
- Tooltips that explain internal specifications of the DeltaMaster analysis session and are needed to build reporting systems (e.g. IDs for referencing cockpits or the selected members of a dimension)
- Tooltips that relate to using DeltaMaster as a Windows application (e.g. explanation of symbols in Toolbars or the completion of entries that have been cut off in a narrow window)
In this edition of clicks!, we will explore the first two categories. We will show which information you can obtain from tooltips to explain the application data and to make it easier to build analytical applications with DeltaMaster. Our goal in doing so isn’t to make a complete list but rather to make you aware of the possibilities and rouse your curiosity. So go ahead and explore your cockpits, analyses, and reports with your mouse! That will get you ready for future DeltaMaster versions, which will certainly contain even more tooltips.
Tooltips of measures
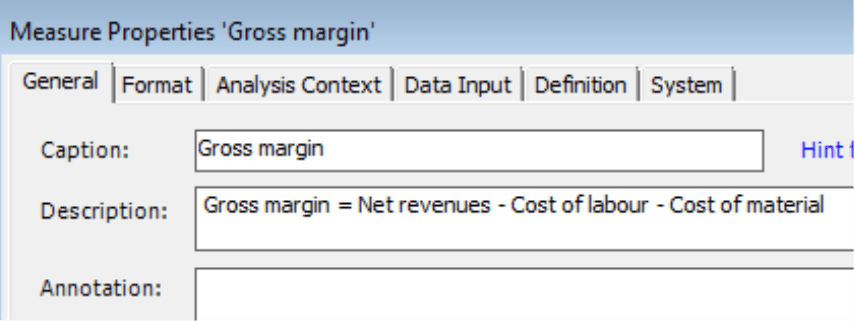
You can add a Description to the Measure Properties on the General tab. DeltaMaster will then display this Description in all cockpits, analyses, and reports when a user mouses over the measure’s name. This feature is often used to document a measure, for example, to explain a calculation or the origin of the data.
![]()
If you want to create a more detailed description, please use the Annotation field in the Measure Properties instead. Annotations will not be displayed as tooltips.
Tooltips in the pivot table
Pivot tables are probably the most important report format in DeltaMaster and contain many tooltips:
-
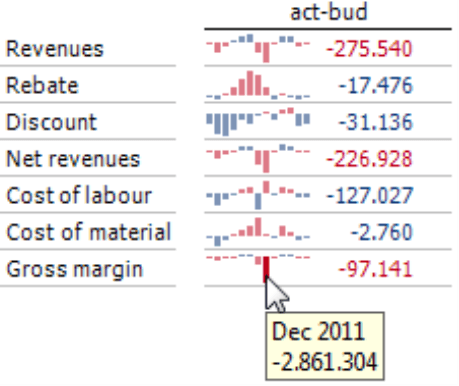
- Tooltips are available for the columns of column sparklines as well as the dots of dot-line sparklines. These display the respective name of the period and the value that the column or dot represents. Many users feel that an advantage of sparklines is that they can view previous values without having to switch to another report. Nevertheless, sparklines are primarily designed for comparing patterns – and not as a control.
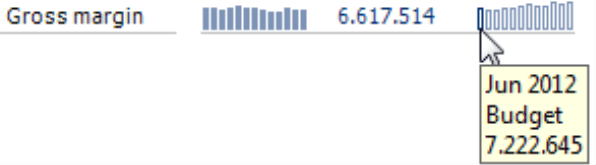
- If you add Preview Values that reference budget or forecast data from a database to the sparkline, DeltaMaster will also display the name of the respective scenario (e.g. “Budget”) in the tooltip. See DeltaMaster deltas! 5.5.3, feature #15.
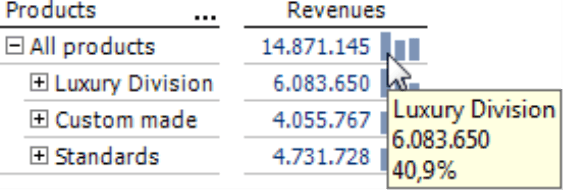
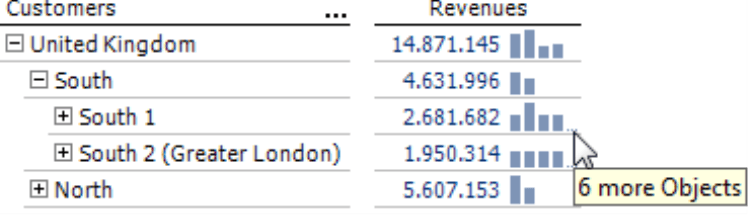
- In Drill Sparklines (see DeltaMaster clicks! 03/2012), the tooltip will display the name of the subordinate member which is represented in the column, the value of this member, and its percentage share of the value in the cell.
If DeltaMaster does not show all subordinate members because there are more members than the limit defined in the Table Properties on the Sparklines tab, it will display an ellipsis at the end of the sparkline. This tooltip will then explain how many members have been omitted.
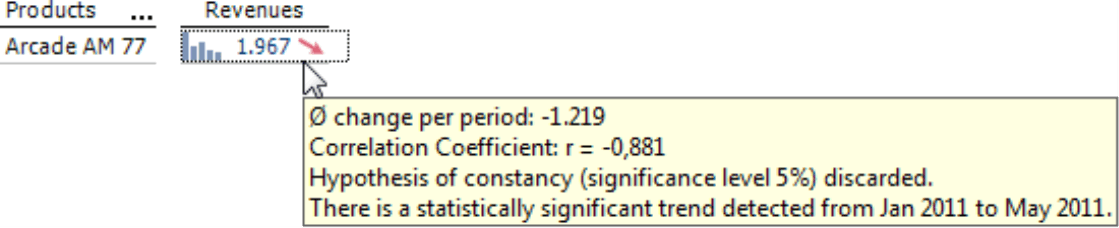
- To make the sparklines even more compact, you can also activate the Trend Barometer, which applies a regression analysis to the values of each sparkline (see DeltaMaster clicks! 12/2007). When you mouse over an arrow, DeltaMaster will display the results of this calculation: the average change per period, the correlation coefficient as well as an indication if the trend is statistically significant. The correlation coefficient will lie between –1 und +1. If it is 0, DeltaMaster cannot detect a linear relationship in the time series.
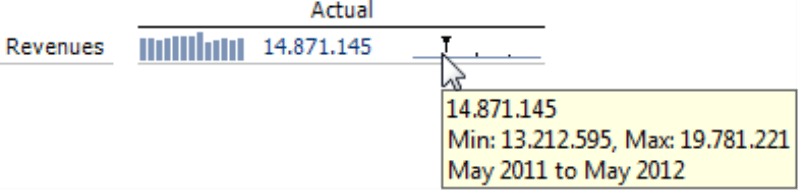
- The Scale also contains an additional visualization for sparklines. It classifies the current value in the range between the smallest and largest value in the sparkline. These are both listed in the tooltip (middle row) along with the current value (first row) and the time frame (last row), whom the sparkline and, therefore, the scale as well describes.
- The tooltip will also specify if you have suppressed outliers in graphic elements. You can activate the suppression of outliers in the Table Properties on the Graphic (2) tab.
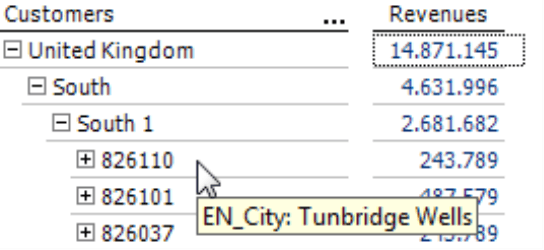
- As of DeltaMaster 5.5.5, you can display member properties either in a table column or as a tooltip (see DeltaMaster deltas! 5.5.5, feature #14). With this option, you can also place additional useful information (e.g. the city name to explain zip code areas or the product names for the respective article numbers) without taking up room in the pivot table.
Tooltips in pivot charts and graphical views of analytical methods
All of the graphic elements in DeltaMaster charts are interactive. If you mouse over them, you will see the object’s value and description as a tooltip. Some of the methods have special features:
-
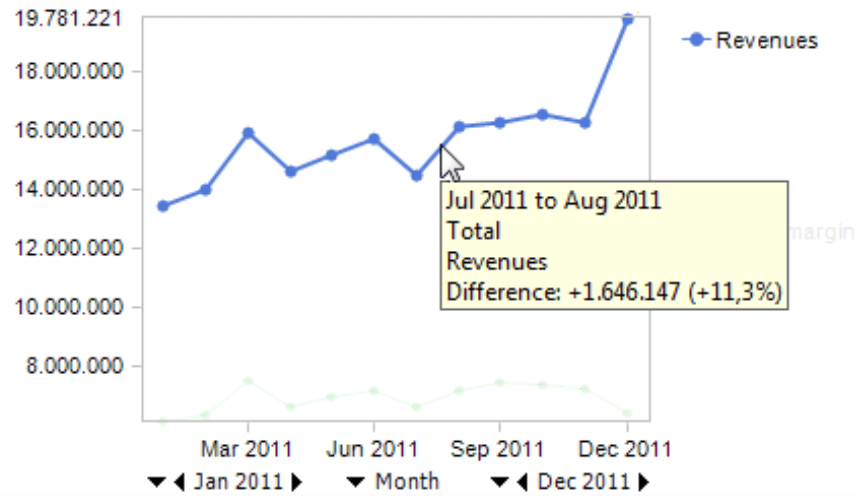
- In a Time Series Analysis, DeltaMaster shows different information in the tooltips depending on where you point your mouse. If you mouse over a dot, it will display the value and the description. If you mouse over the connection lines, however, you can view the absolute and relative differences. If the chart shows Trend Lines, the tooltip will also show the linear equation, the correlation coefficient, and an indication if the trend is “significant” or not.
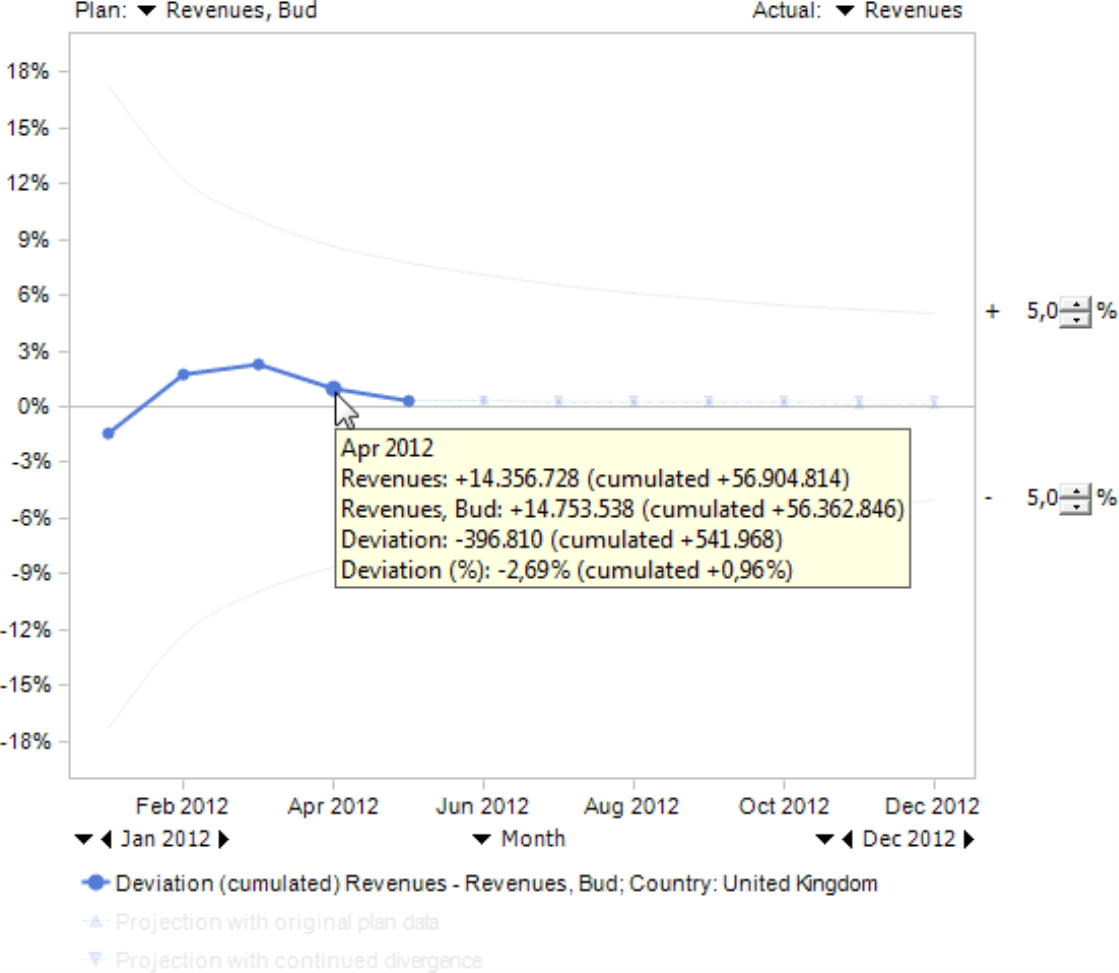
- The Trumpet Curve works with two measures – the plan and actual values – and shows the cumulated variance as a percentage. The tooltip displays the individual values (i.e. plan and actual) as well as the absolute and relative variance for the dot – each as a cumulated and non-cumulated value. If you activate the Projection, DeltaMaster will display the projected variance. For more information about the Trumpet Curve, please read DeltaMaster clicks! 05/2007.
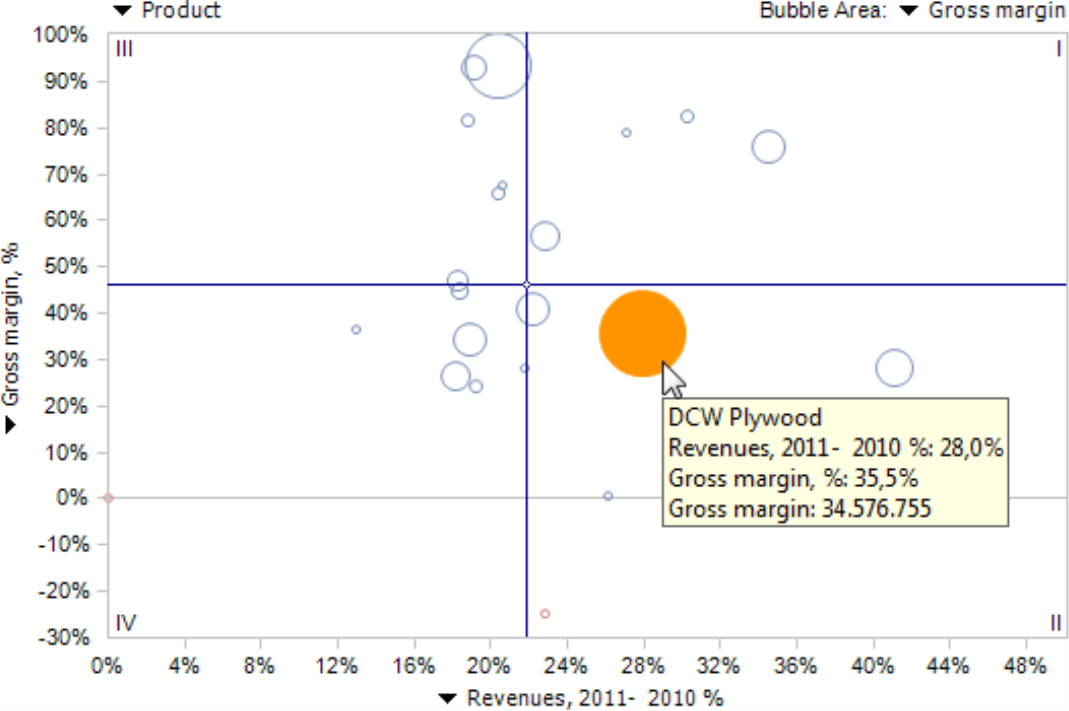
- In a Portfolio Analysis, the tooltip of a bubble displays the name of the member as well as the values of the two or three measures for this member (i.e. the values on the axes and the value of the bubble’s area). If you activated Lines in the context menu or I want to… menu (i.e. an Equivalence Line, Average Line, or Regression Line), the tooltip would display the respective linear equation.
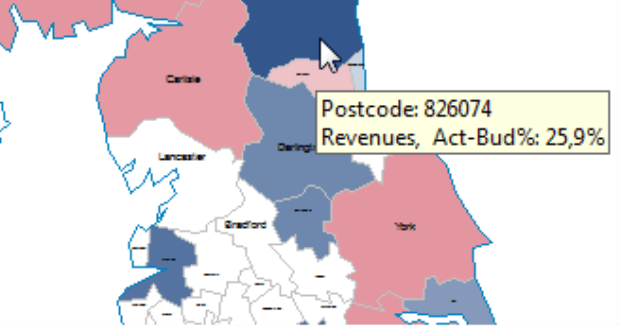
- In a Geo Analysis, the tooltip displays the name of an area as well as the respective value. If Graphics are activated in the Settings (see DeltaMaster clicks! 05/2005), they will contain their own tooltips that itemize the values in the chart.
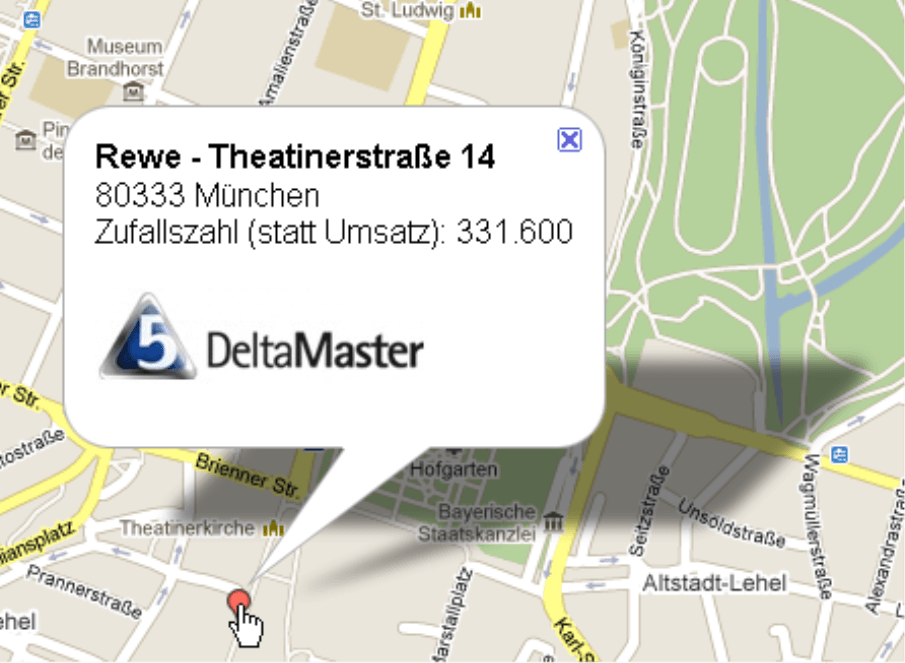
- In a Location Analysis withGoogle Maps, you can define what DeltaMaster should display in the tooltips of the markers. Here, you can also use variables for names and values of the measures and member properties. For more information, please read DeltaMaster deltas! 5.4.6, feature #1g.
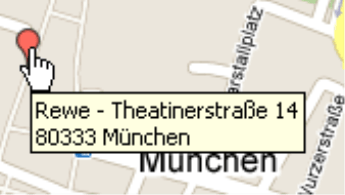
If you use info windows, which are an advanced form of tooltips, you can even format the output, integrate images, etc. in HTML.
- The Overview of the Comparator contains a tooltip that shows the respective member name, both values, and their percentage of the total value for each column pair. Since you can preview the values and, therefore, the results in this overview, many times you won’t even need to open the individual chart.
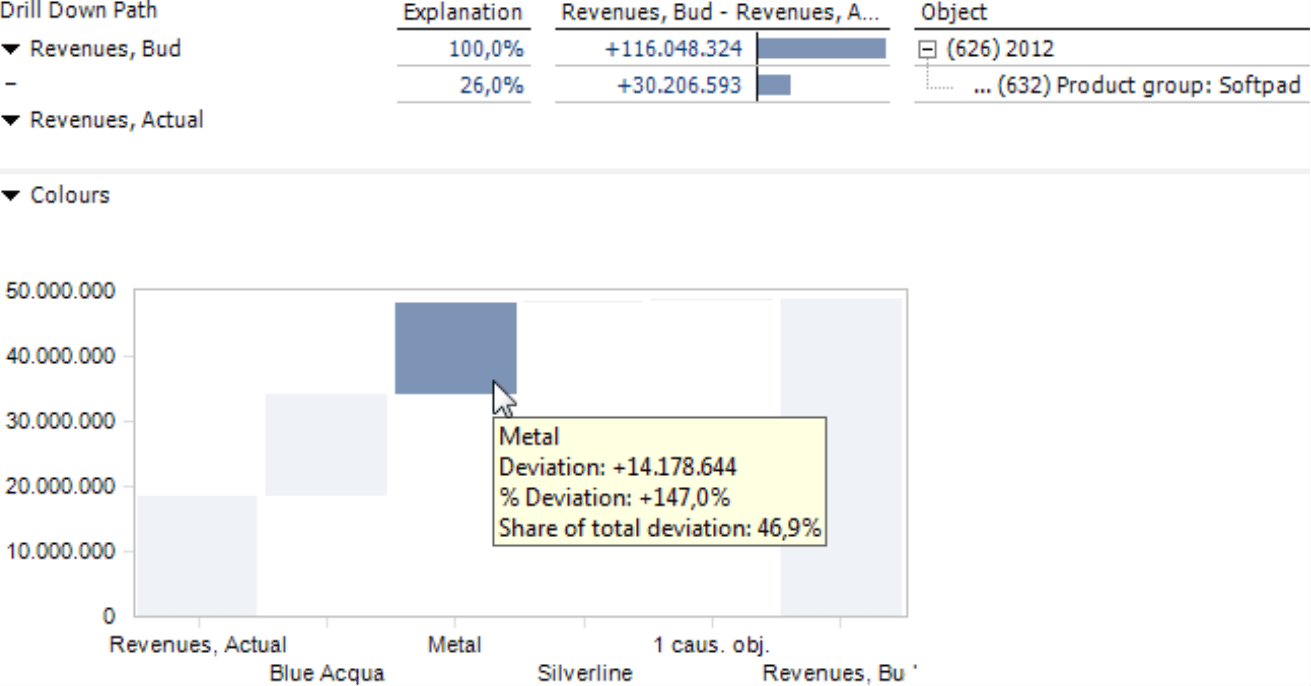
- In a Waterfall Analysis, the tooltip displays the value of the member, the absolute and relative variance between the measures that you are analyzing as well as their percentage of the total variance.
Tooltips for links
In Combination Cockpits and Flexreports, you can create links to other cockpits, analysis templates, reports, external documents, websites, or PDF files. DeltaMaster displays the link target in a tooltip. If you are working with Flexreports that reference pivot tables, you can also place one of the links that were defined in the pivot table directly in the Flexreport cell to create a hyperlink (see DeltaMaster deltas! 5.5.1, feature #20). The Target or the Description of this pivot link is also displayed in the tooltip.
Tooltips in presentation mode
You can access all of the tooltips described on the previous pages in DeltaMaster’s Presentation Mode (View menu or F5 key). The tooltips offered in this mode are particularly interesting. You can first view the prepared reports in the presentation and then interactively focus on individual objects from the reports in the following discussion. The tooltips provide more in-depth information.
Tooltips with technical information for report editors
To build larger applications, report editors often need technical information which they can use in MDX expressions, formulas, or references. You can use tooltips to quickly access this information. Please note, however, that technical tooltips only work if you hold the Alt key while mousing over the object. This isn’t the case for the “content” tooltips that we have described previously; you don’t need to press a key to display them. DeltaMaster will only display the following tooltips if you hold the Alt key while mousing over an object:
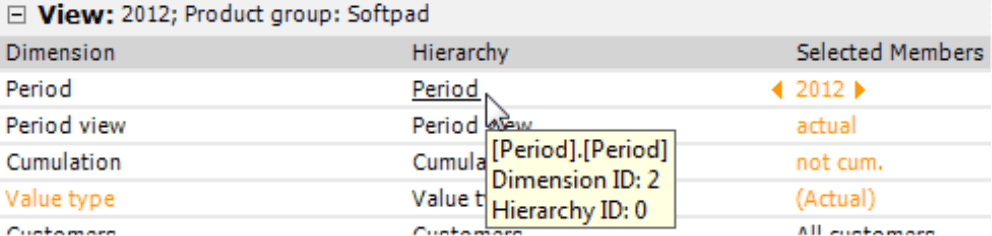
- In the View window, a tooltip will show the MDX names, the dimension IDs, and the hierarchy IDs. You need a dimension ID, for example, in MDX expressions such as “<viewX>”, in user-defined measures, in names of reports or headlines, or as a variable in ReportServer export templates (“@Dxx”).
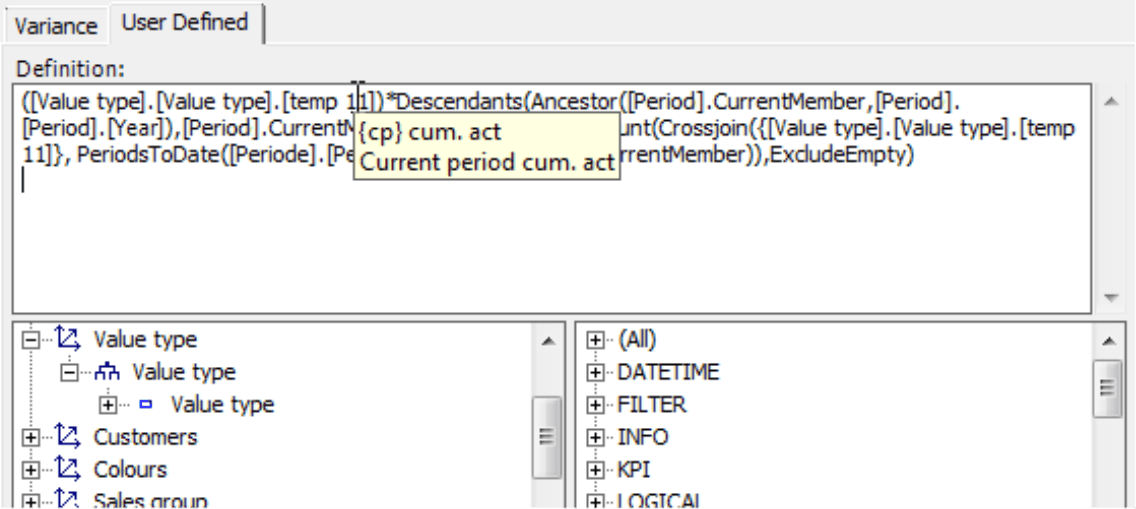
- In the MDX Editor that is used to modify user-defined measures, calculated measures (see screenshot on your right), named sets, and other MDX expressions, you can access tooltips in all three window partitions. Above in the Definition, you can view the DeltaMaster names of calculated members and measures. In the tree structure on the bottom-left side, you can see the MDX names of the dimensions’ IDs. In the functions overview on the bottom-right side, DeltaMaster will display the syntax of the function and a short description.
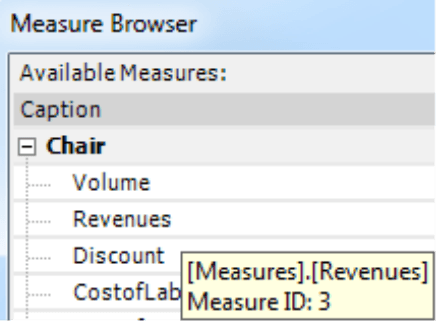
- In the Measure Browser, tooltips will show the MDX names (e.g. for use in user-defined measures) as well as the IDs of measures (e.g. to add MDX expressions such as “<measureX>” to headings; see DeltaMaster deltas! 5.5.3, feature #4).
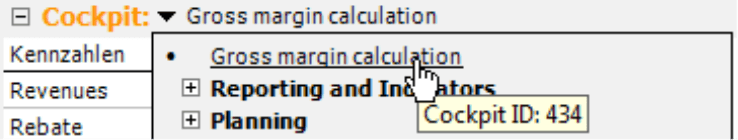
- In the Cockpit Browser and in the cockpit list of the Cockpit window, a tooltip will display the cockpit’s ID. You can use this ID, for example, in formulas of Flexports that work with values from other cockpits (e.g. “Cockpit3!R7C4”).
- In a Flexreport, the tooltip will contain referenced pivot tables, formulas, and variables such as “<language>”. This allows you to identify the definition of a cell without having to switch to the Cell Properties.
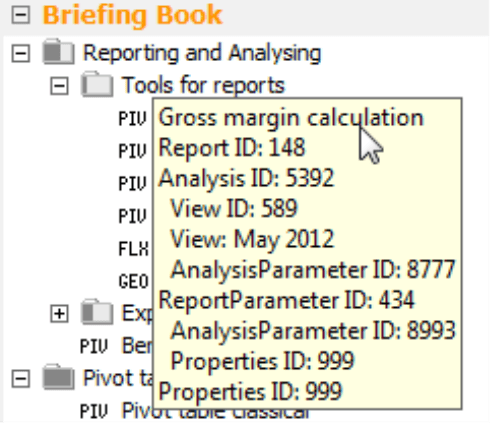
- In the Briefing Book, the tooltip primarily shows the IDs of the report folders and reports. You often need these IDs, for example, in ReportServer variables or as a command line parameter (e.g.
“-report” or “-kiosk”; see DeltaMaster clicks! 08/2012. For more information on kiosk mode, please read DeltaMaster clicks! 01/2011).
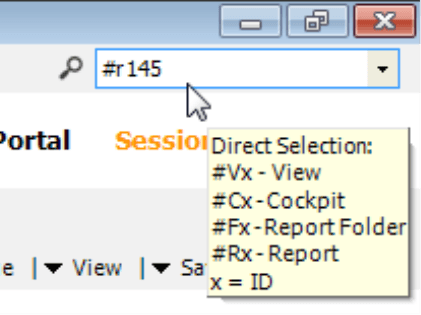
These IDs are useful if you do a Direct Selection in the search field on the right side of the main menu bar of DeltaMaster. If you enter “#r145”, for example, DeltaMaster will open the report with the ID 145. The syntax for the Direct Selection, in turn, is displayed as a help text in a tooltip (without the Alt key because this way of calling up information isn’t just beneficial for report editors).
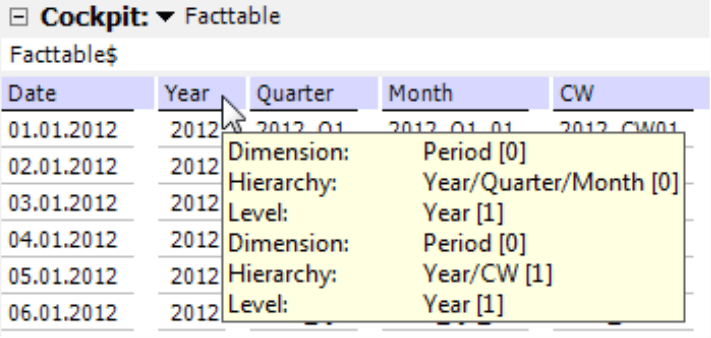
- In the DeltaMaster TableWizard, the tooltips of column headers in fact tables show in which dimensions, hierarchies, and levels the column is used. If you press the Alt key, DeltaMaster will also display the IDs in brackets.
Even more tooltips
DeltaMaster offers additional information in the form of tooltips in many other areas of the application. Unless stated otherwise, you can access the following tooltips without needing to press a key as well.
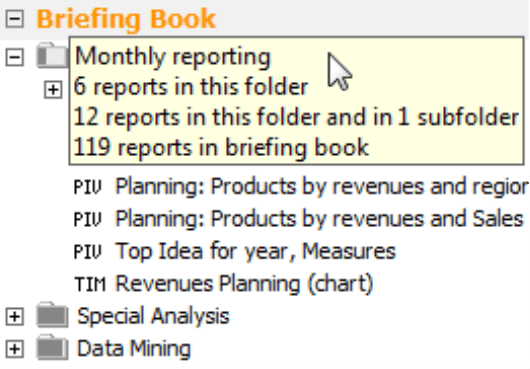
- In the Briefing Book, you can mouse over a folder symbol to see how many reports are contained in that folder – in other words, how “thick” the folder is (see DeltaMaster deltas! 5.3.4, feature #6). If you hold the Shift or Ctrl key and mouse over a folder, the tooltip will show how many reports are in the current folder and the briefing book as a whole. If there are subfolders, DeltaMaster will also list the number of subfolders and the number of reports that are contained in them.
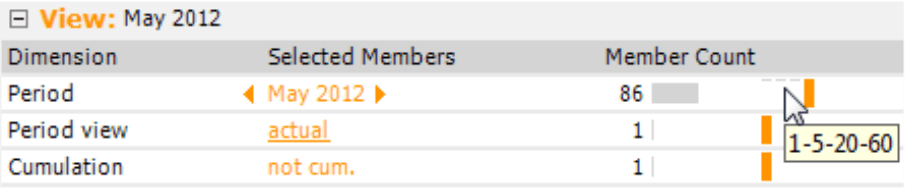
- In the View window, the miniature chart next to the Member Count contains a tooltip. The numerical order lists the number of measures on each level of the hierarchy. The time dimension shown in the screenshot on your right contains 86 members: The first level contains one member (“All Years”) while the second has 5 (years), the third has 20 (quarters), and the fourth has 60 (months).
- In the Portal, the tooltips of recently used analysis sessions and models show the complete path of the respective analysis file. For other files, this tooltip is not necessary because DeltaMaster displays the folder where it is saved in the portal.
- In planning applications, you can use tooltips to make cell comments visible. You simply mouse over the red triangle in the upper right corner of the cell.
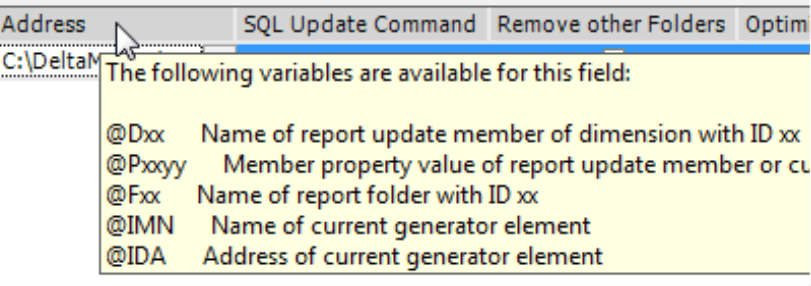
- In ReportServer a large tooltip explains the variables that you can use in the Address, Export template, and in the e-mail fields.
“Tooltips” in the DeltaMaster TickerApp
There are no tooltips in tablets such as the iPad and other touch devices because they do not have a pointer that “floats” over the interface and can be used to “touch” objects.
In the DeltaMaster TickerPortal, an app for iPad and iPhone devices, you can still open a detailed view for the columns of sparklines. If you tap with your finger on the desired column and hold it there, a small window will appear that displays the value and the period of the column. If you leave your finger on the screen and swipe it to the left or right, the detailed display will change as well so that you can view information on all of the columns.

Questions? Comments?
Just contact your Bissantz team for more information.
