CiAgICA8IS0tIExpbmtlZEluIC0tPgogICAgPHNjcmlwdCB0eXBlPSJ0ZXh0L2phdmFzY3JpcHQiPgogICAgICAgIF9saW5rZWRpbl9wYXJ0bmVyX2lkID0gIjEyMzUwNzMiOwogICAgICAgIHdpbmRvdy5fbGlua2VkaW5fZGF0YV9wYXJ0bmVyX2lkcyA9IHdpbmRvdy5fbGlua2VkaW5fZGF0YV9wYXJ0bmVyX2lkcyB8fCBbXTsKICAgICAgICB3aW5kb3cuX2xpbmtlZGluX2RhdGFfcGFydG5lcl9pZHMucHVzaChfbGlua2VkaW5fcGFydG5lcl9pZCk7CiAgICA8L3NjcmlwdD48c2NyaXB0IHR5cGU9InRleHQvamF2YXNjcmlwdCI+CiAgICAgICAgKGZ1bmN0aW9uKCl7dmFyIHMgPSBkb2N1bWVudC5nZXRFbGVtZW50c0J5VGFnTmFtZSgic2NyaXB0IilbMF07CiAgICAgICAgICAgIHZhciBiID0gZG9jdW1lbnQuY3JlYXRlRWxlbWVudCgic2NyaXB0Iik7CiAgICAgICAgICAgIGIudHlwZSA9ICJ0ZXh0L2phdmFzY3JpcHQiO2IuYXN5bmMgPSB0cnVlOwogICAgICAgICAgICBiLnNyYyA9ICJodHRwczovL3NuYXAubGljZG4uY29tL2xpLmxtcy1hbmFseXRpY3MvaW5zaWdodC5taW4uanMiOwogICAgICAgICAgICBzLnBhcmVudE5vZGUuaW5zZXJ0QmVmb3JlKGIsIHMpO30pKCk7CiAgICA8L3NjcmlwdD4KICAgIDxub3NjcmlwdD4KICAgICAgICA8aW1nIGhlaWdodD0iMSIgd2lkdGg9IjEiIHN0eWxlPSJkaXNwbGF5Om5vbmU7IiBhbHQ9IiIgc3JjPSJodHRwczovL3B4LmFkcy5saW5rZWRpbi5jb20vY29sbGVjdC8/cGlkPTEyMzUwNzMmZm10PWdpZiIgLz4KICAgIDwvbm9zY3JpcHQ+CiAgICA8IS0tIEVuZCBMaW5rZWRJbiAtLT4KICAgIA==
Generic filters
Exact matches only
Search in title
Search in excerpt
Search in content

Your companyat a glance.

Mobile key figure controlwith the DeltaApp

With our app, you always have the most important data with you, even offline. To navigate the data, analyze variances, and compare key figures, you swipe and tap on your smartphone – guided by a unique visualization without charts. We call this “Haptic Reasoning” and have patented it.

learn more
Without installation

With your finger and mouse, you can navigate through your data independently of the end device and without local installation – via web browser. In planning, you can also enter data on a mobile device, such as a tablet. Suppliers, customers and partners can also be provided with interactive data for improved collaboration.

learn more
Planning, Self-Service, Data Science

On the PC, power users from controlling and the business departments use our software for data mining, ad-hoc analyses, plan input, simulation and for the editorial design of the controlling landscape and the planning workflow. Connecting and integrating new data sources is also best done with mouse and keyboard.

learn more
Our software convinces market leaders, hidden champions and industry experts.

Our customers are convinced and enthusiastic. When you ask them why they chose us, they unanimously cite these criteria:

Our software convinces
market leaders, hidden champions and industry experts.

Our customers are convinced and enthusiastic. When you ask them why they chose us, they unanimously cite these criteria:


Perception

Immediately grasp what matters most – through clear and uncluttered design.


Performance

Create, edit and send reports at top speed – through customized automation.


Compatibility

Seamless connection to all relevant upstream systems and databases.


Operability

Intuitive operation through guided menu structures and effective editing steps.


Flexibility

Countless application, combination and expansion options – in all industries, for all functions.


All-in-one

One software, all possibilities – analysis, planning and reporting combined in one application.

Inform in passing

Our kiosk systems hang in hallways, meeting corners and break rooms. They permanently reflect the progress of everything that drives the company’s success. In this way, you also inform people beyond your own area of responsibility. Because being informed creates understanding and trust.

learn more
Panoramic view instead of keyhole

Our business control station shows a multiple of content on the surface of a usual beamer projection, with the same readability – for example, processes from sales and production in real time or detailed location analyses for entire economic areas. Put an end to scrolling through cutouts in the meeting!

learn more
Informed at every turn

On the floor and on the wall, in halls and corridors, a number says more than many words. Our software projects values wherever you want – with distortion correction and any passe-partout. This way, key figures can no longer be overlooked and everyone knows where they are walking and standing.

learn more
From all Data sources 

In two hours to the finished application


From all Data sources 


In two hours
to the finished application


one software for all tasks.

Analysis, planning and reporting – controlling as a control loop

Analysis

Dashboarding and analysis are seamlessly linked in our software. Reports and signals are clear and precise, and our notation concept regularly wins awards. Special methods are available for special issues, such as geo-analysis, data mining, cross-report analysis and forecasting.

learn more
Planning

Easily create applications for bottom-up and top-down planning – with distributed and decentralized data entry. You maintain master data and authorizations, log and monitor input, reconciliation and release. You comment on and simulate plan corrections during the year and on an ongoing basis – closely interlinked with reporting and variance analysis.

learn more
Reporting

Our software offers all necessary functions for reporting, such as: Report display, report generation, report distribution, self-service or role management. Active report recipients are provided with powerful and comprehensible mechanisms for data navigation and fluid switching from overview to details for ad-hoc analysis.

learn more
one software for all data.

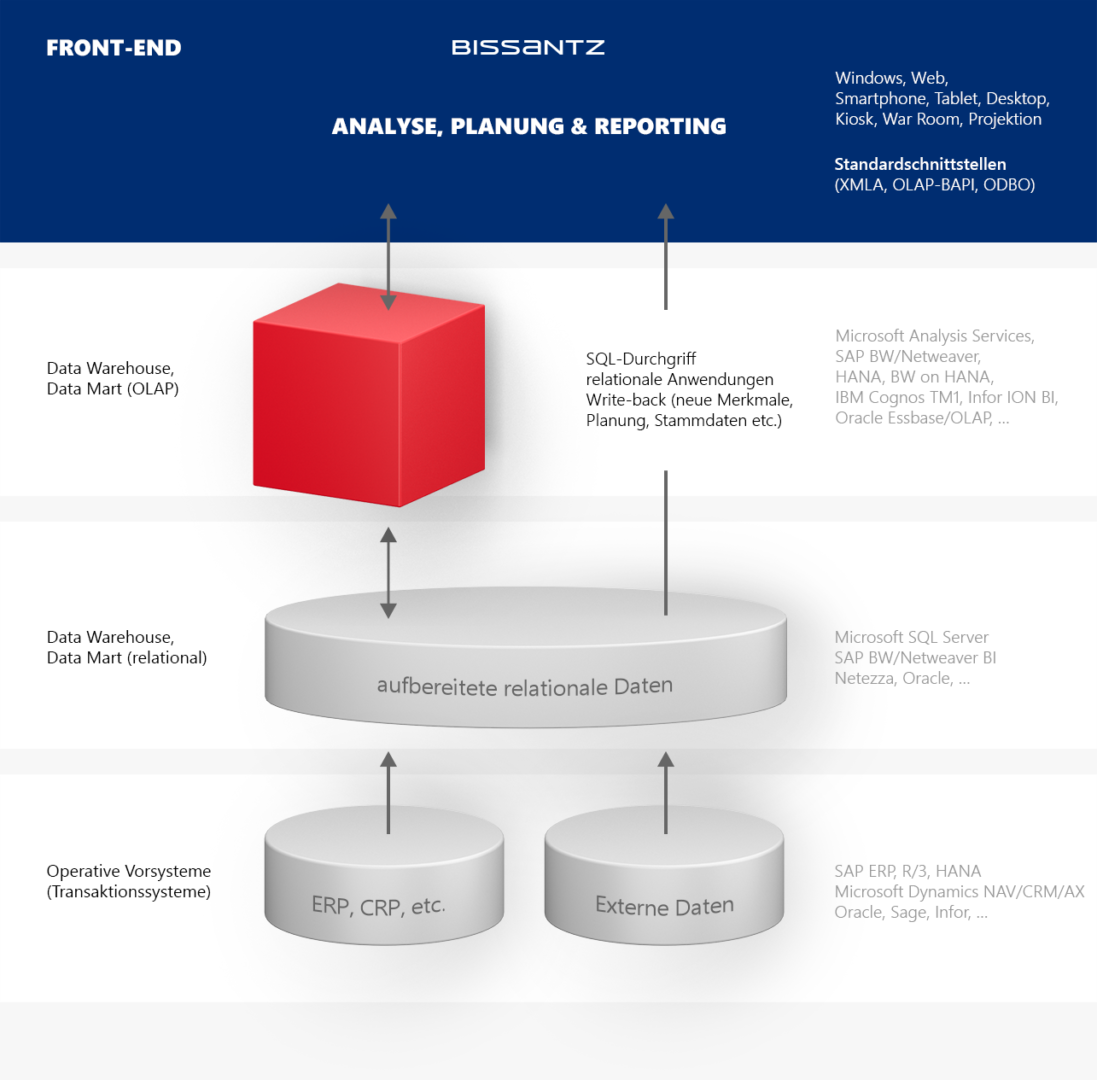
Order in the data warehouse

ETL

Modeling and automation of the analytical data warehouse are the foundation of efficient business intelligence projects. With our project tool Bissantz ETL, our consultants and active customers link data from different systems, ensure data quality and performance even with large data volumes, and control access permissions.

learn more
ERP Solutions

Bissantz ERP Solutions show what is possible with AI-based data modeling. As standardized as possible, as individual as necessary, a ready-packaged business intelligence system based on the typical SAP modules is created in the shortest possible time – with all the necessary steps, from loading the data to automatic data supply to mobile devices.

learn more
Meta Data

An analytical data warehouse is not just a filtered, cleansed and condensed selection of ERP data. To create the business perspective, it often needs data and structures that do not exist in ERP: Meta data for mappings, authorizations or additional master data. The Bissantz Meta Data tool helps with the structured setup, entry and maintenance.

Frame

The procedures required to build and operate an analytical data warehouse, created and automated with Bissantz Meta Data, are quickly given the same appealing interface for parameter entry and control that you are used to with our other software products. This is ensured by the Bissantz Frame tool.

Many databases, one application.

With one software for all business situations.

Business intelligence can be quite simple if you can quickly draw the right conclusions from data. From our more than 25 years of experience, we know which hurdles exist and how to overcome them.

  • See faster what is really important
  • Navigate the depths with the highest performance
  • To the finished report in two hours
  • Obtain data from all sources (SAP, DATEV, Excel, etc.)
  • AI-driven automation

Not only good, but also patented.

This is something that only we have.

Graphical tablesBetter than diagrams

Tables are regularly underestimated, but they create order, clarity and reliability. And with graphic elements in the cells, they fulfill the tasks of visualization: they direct the eye to what is important. Our AI components take care of scaling, colors, layout and the appropriate graphic type.

Typographically scaled numbersSmall values small, big values big

For dashboards, tables and maps, we have created a new format: Bissantz’Numbers. These “numerograms” are as simple as they are effective: the larger the value, the larger the number is written. The number thus becomes an image itself – the accuracy of the number combines with the emotional impact of graphics.

learn more
HyperbrowserFind instead of search

With the Hyperbrowser you can illuminate even complex structures. Hierarchies are fanned out in a star-shaped projection, e.g. the organization, customers or material. Using drag-and-drop, the leaves are colored in blue and red. This makes the drivers of the respective key figure visible – even hidden compensations.

Small MultiplesMultiple quite simple

Small Multiples repeat the report structure for multiple report objects and automatically arrange the subreports. The result is multiple reports with tiles that allow a variety of comparisons – and are easy to read at the same time: Perception gets a rhythm and thus routine, and this relieves the reader.

Whitepaper download.
Checklist for BI software

What is important when deciding on business intelligence software? The selection process has many stakeholders: IT and business department, management and controlling, administrators, users and …

learn more
DeltaMaster in reporting

See, understand, act! Whether business intelligence is effective is decided on the last meter: All the effort of data collection, storage and preparation is in vain if …

learn more
DeltaMaster in planning

Don’t leave success to chance! We cannot predict the future – but those who do not plan leave it to chance or competition. Plans give orientation to one’s own actions …

learn more
DeltaApp

DeltaApp – decide more with less data: Business Intelligence moves – from the desk to the cell phone – and thus to where it is needed …

learn more
DeltaMaster ETL

Modeling and automation in business intelligence projects: The foundation for planning, analysis and reporting is the data warehouse. It links data from different systems, provides …

learn more
Agile Business Intelligence with SAP data

Bissantz ERP Solutions show what is now possible with AI-based data warehouse modeling. As standardized as possible, as individual as necessary, a complete data warehouse is created in the shortest …

learn more
The 12 most common data visualization mistakes

Data visualization (DataViz) in companies places high demands on clarity and comprehensibility. We have compiled the most important and most common mistakes for you.

learn more
Whitepaper: Two colors are enough

The clarity of commercial thinking can also be seen in the usual pairs of terms: With receipts and payments, income and expenses, or debits and credits, we describe in a universal way the processes …

learn more
Business Intelligence Trends

We have carefully read what market analysts and futurologists are predicting and talked to customers and market observers.

learn more
Business news case study: better without charts

What do we learn for business intelligence from business news charts? We have made a current case study about this. It once again confirms what we have been doing unchanged for more than 12 …

learn more
Little Hänschen or Moonlight Sonata: Are we entering a complexity crisis?

Little Hänschen or Moonlight Sonata: Are we entering a complexity crisis? Is the software industry and everyone who depends on software heading for a complexity crisis? My doctoral advisor had me …

learn more