“We understand linear scales but can’t make any sense out of logarithmic ones,” some people say. We say that most people understand linear scales…incorrectly. And only logarithmic scales portray things correctly. Whether people understand why this is the case does not change the fact. Here’s the proof.
We still can’t get the recent news – and charts – of the U.S. national debt off our minds. Last time, we argued that you shouldn’t display the development of absolute values on a linear scale – at least not when large differences in the values are involved. Otherwise, it inevitably leads to distortions, exaggerations, and misinterpretations.

Spendthrifts or economic growth drivers? George Bush Sr., Barack Obama, George W. Bush, Bill Clinton and Jimmy Carter in the Oval Office.
The fact that the U.S. national debt is approximately as high as the annual U.S. gross domestic product (GDP) is a complicated issue on which even economists fail to see eye to eye. Instead of warning us about what might occur, however, sensationalizing the issue with panic charts is in our opinion more likely to make the dreaded scenarios come true.
Back to visualization: Last time, we established that you can never go wrong with logarithmic scales and rarely do something right with linear ones. We showed that based on the absolute increase of the U.S. debt over the years. Now we want to verify if this also applies to percentage values. We can investigate that by looking at how the U.S. debt has developed in comparison to GDP. So, let’s enter the debt as a percentage of GDP.
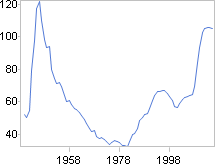
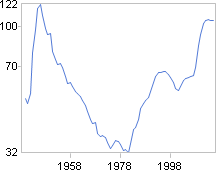
The U.S. debt as a percentage of GDP from 1940 to 2016 (estimated for 2011 to 2016) – linear scale on the left, logarithmic scale on the right.
As you can see, linear scales also distort percentage values. The degree of distortion, however, depends on the range of the values and has nothing to do with absolute or percentage values. And this range can also be large enough in the case of percentage values to make a chart misleading. In the case above, I think that the extent of the distortion is tolerable, since it hardly changes the fundamental interpretation of the development.
With regards to content, however, we are still missing the comparison to the GDP development. Those who favor deficit spending say that federal investments financed with debt increase GDP – and what matters is how wise these investments are, not the size of the debt. They say, as long as GDP growth is higher than debt growth, incurring new debt is good for the economy. Okay, so let’s take a look at debt and GDP combined.
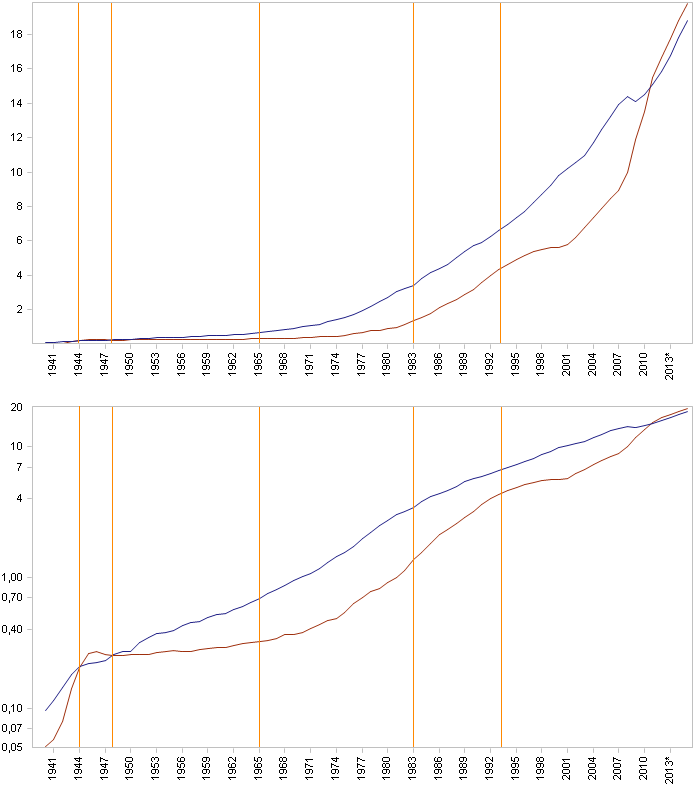
The U.S. national debt (red) compared to U.S. GDP (blue) from 1940 to 2016 (estimated from 2011 to 2016) – top chart with a linear scale, bottom chart with a logarithmic one. Click to enlarge.
Since the selected 75-year time frame is impressively long, we should take some time to examine this wealth of information more closely. Take a good look at the chart with the linear scale, then the chart with the logarithmic one, and see for yourself:
- You can’t get much information on the first 25 years from the linear scale. The large values at the end of the series dominate the small values at the beginning. You think you are seeing the development of the data when in reality you aren’t. Your look at the historical data does not achieve the desired result, and collecting the data was a waste of time. And worst of all, you have a completely wrong impression.
- The logarithmic scale shows that the sharpest rise in debt in the past took place in the 1940s. From 1944 through 1948, the debt was larger than the GDP. From 1948 on, GDP growth was always clearly larger than that of the national debt.
- If you look at the linear scale between 1965 and 1983, you think you are seeing the “good old days”. GDP growth was apparently much faster than that of the national debt. The logarithmic scale, however, straightens out the story. It shows a development that is almost parallel and, in fact, it is. The GDP and national debt grew by 400 and 326 percent respectively in this period.
- The period from 1983 to 1993 is also deceptive but in the opposite way. Although the gap between the data actually decreased, the linear scale shows a seemingly parallel development. While the GDP rose by 90%, the overall debt on the other hand tripled in this period. This is the reality – and this is what the logarithmic scale shows.
We wanted to prove that you don’t have to know logarithms in order to understand logarithmic data. However, you need to know the pitfalls of linear scales if you don’t want to misinterpret linear data. In our example, you would have to see the pattern of the logarithmic scale in the linear chart to still be a skeptic regarding logarithms. You would have to be able to identify and interpret all the distortions of the linear chart just by looking at it. My eyes couldn’t do that – could yours?
