We have got a sense for numbers. Naturally. Or acquired. Doesn’t matter. Anyway: it brings space and numbers together. Linearly and proportionally. Intuitively. Automatically. Because of that my law of proportions: Graphical changes have to be proportional to the changes in values depicted by a graph. This sense for numbers can be verified. With an experiment. I have done it. With the people in the office here. Everyone had to draw an image. That’s what I asked them:
“Take a piece of paper. No matter what paper. Draw a straight line on it. As long as your hand is wide. Approximately. Not too short. Not too long. Write zero on one end. Write 100 on the other. Draw marks for 25, 50, 70, 80 on your line.”
That’s what they drew:
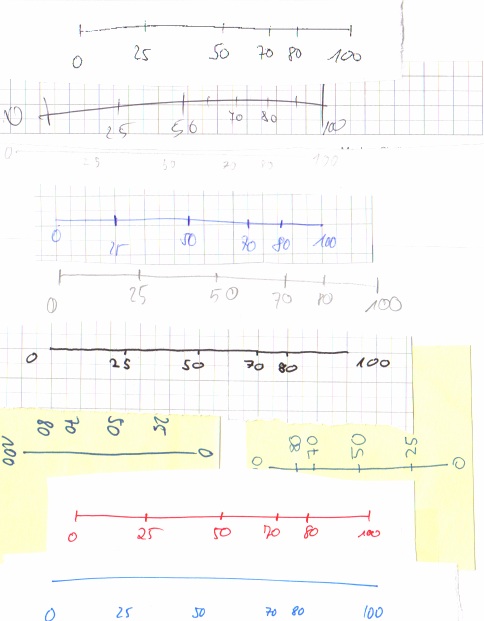
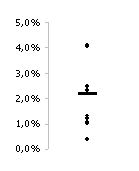
The people did quite an accurate job. Here are the deviations from an exact scale:
Consequently, in every graph: Everything must be proportional to the depicted values. Column lengths, for instance. Without proportion is manipulation.
