If you want to compare something, put it on the same level.

Works with numbers, too. Even when they are connected. Like in time series. Jan did it like this. The small lines where concatenated before. One line started where another one ended. Now they are split. And start on the same level.
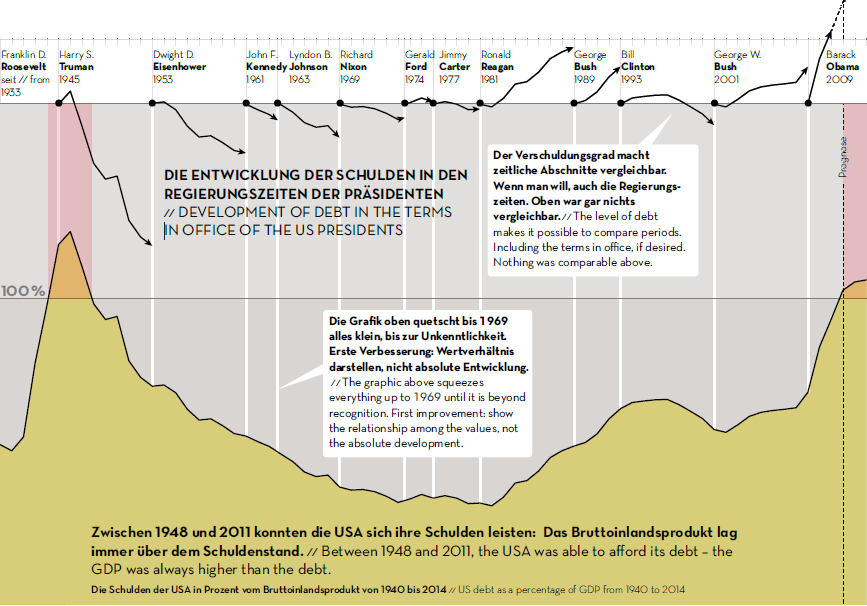
U. S. debt as a percentage of GDP. Source: IN GRAPHICS Vol. 3, Berlin 2011, pp. 26-27.
Next picture also. Click to enlarge.
You almost had to take the logarithm. But it’s still okay.
Index time series are on the same level anyway. Jan put one after another. Good.
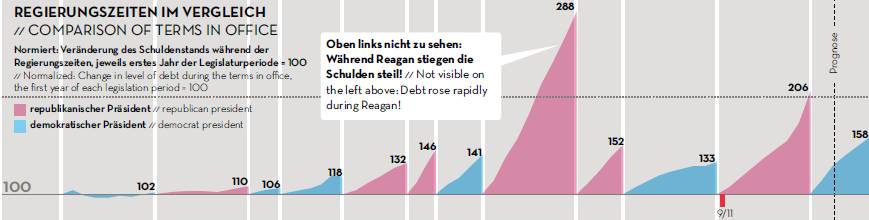
Change in level of debt during the terms in office. Click to enlarge.
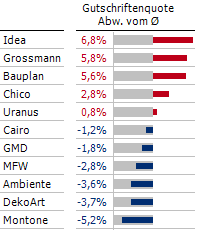
The common level may also be in the middle. Here the line is the mean of a rate that’s interesting for managers. Credit notes.
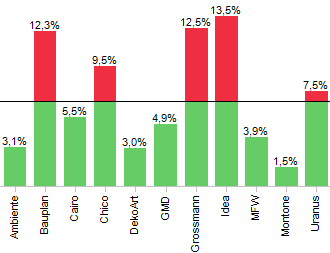
Source: Pivot chart, by me.
The same figures as a graphical table. Compact and legible. Structure top-down. Again, the mean is the line. Good.
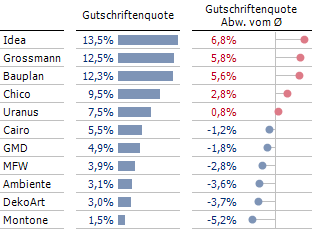
Source: DeltaMaster.
Same Data, another graphical table. The mean is the gray bars. Good, too.
Source: DeltaMaster.
By the way: I have cheated. I sit on the same level as the lion. But the photographer doesn’t look from the front. Now he does. I am smaller.