Apropos competent with media. Leo from the Süddeutsche Zeitung (SZ) got width, height and position. But that doesn’t mean anything. The 100 % value can be at the top middle, bottom middle or in the middle right. No meaning.
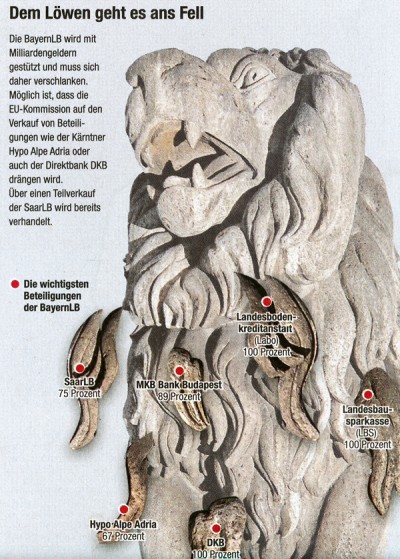
Source: Süddeutsche Zeitung, 2009-04-29, p. 31. The red dots are labeled with the names of the most important shareholdings of BayernLB (Bank of the state of Bavaria) and with the percentage held by BayernLB. The article suspects that some of them may be sold. Click to enlarge.
Same issue: The annual average temperature is rising, I thought. Not the temperature is rising but each year. Not cold at the bottom but 1901. At the top it’s pretty warm but above all 2008. The temperature is next to the year. But no clue what it was like in other years. This chart stinks.
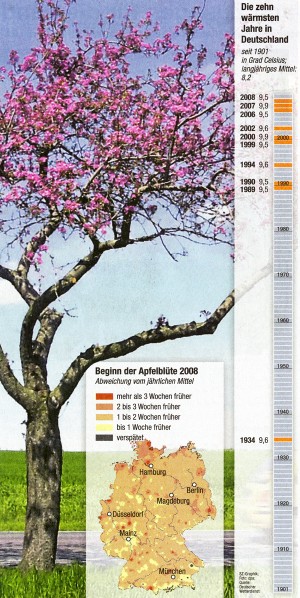
Source: Süddeutsche Zeitung, 2009-04-29, p. 6. On the vertical scale: the 10 warmest years in Germany since 1901, the long-time average is 8.2 degree Celsius. Click to enlarge.
That makes me sad. The journalists of the Süddeutsche Zeitung do a good job. But who believes in good research with such bad drawings?
Frustrated, I turned to watch television. No help either. The TV guide, “TV Today”, was from last week. The charts were as bad as in Süddeutsche Zeitung. But not even worse. Oh my goodness.
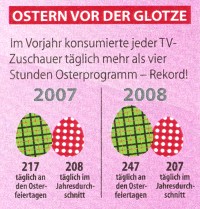
Source: TV Today, 2009-04-11, p. 4. TV consumption in 2007 and 2008 in minutes on easter holidays (green) and average for the whole year (red).
