Business charts are losers. Its only good luck if they work at all. He has shown some basic problems of them. With mine here, you need more brains than luck to find the truth.
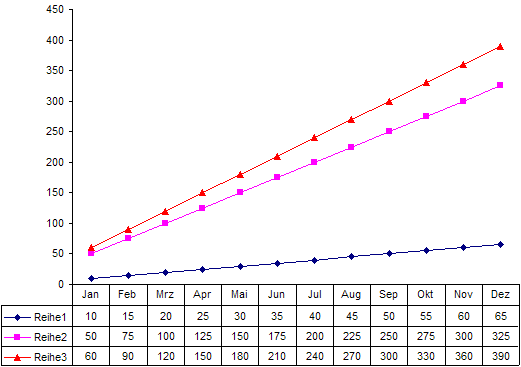
Each series increases with the same amount per month. The first increases by 5, the second by 25 and the third by 30. All increase with the same relative dynamic. From January to February by 50%, next months by 33%, then 25, 20, 17, 14, 13, 11, 10, 9, 8%.
The eye is sure to see something different. The increase of the bottom most series seems dull compared to the top most. And even a difference in dynamics between the two top most series appears to be plausible.
All wrong.
Sparklines are much better suited. They present the first series as  65, the second as
 325 and the third as
  390. More general: Want to compare different time series? Then scale them individually. It doesn’t work in one single chart.
