Many cut axes just because of Excel. And go to charting hell. Because when you cut you distort. And when you distort you lie. At least with your graph. The graphical change in your data is no longer proportional to the change in values. He explains it quite well with a demolished graph from the SportAuto magazine. Here is a positive example. From the German newspaper “Die ZEIT”. This newspaper is off the mark sometimes, too.

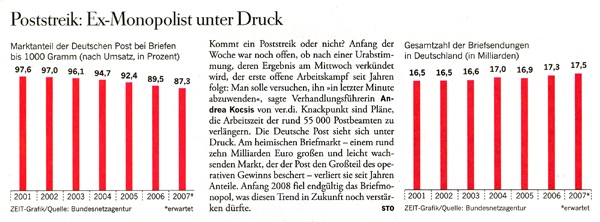
Die ZEIT, 2008-04-30, p. 37, market share of Deutsche Post (left) and number of letters in Germany in billions (right)
All my rules are observed. Time runs from left to right. Scale starts at zero. The graph is proportional to its values. No exaggeration. No gadgets. No unnecessary percentage signs. Letters in billions, not in single pieces.
In the same issue another good graph. Structure is shown top-down. Labeling where it belongs: next to the columns. At least for the values. I would have left out the series “andere” (“others”). The dots, too.

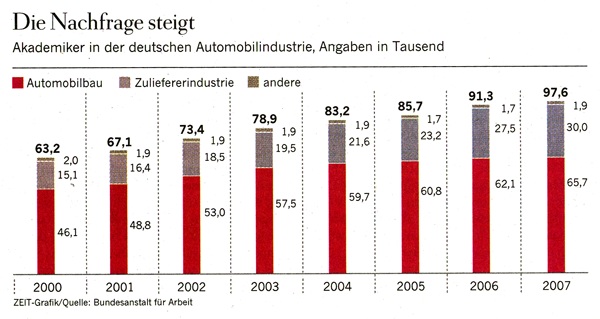
Die ZEIT, 2008-04-30, p. 78, academics in the automotive sector, for automobile manufacturers and suppliers
"
["post_title"]=>
string(10) "Leistungen"
["post_excerpt"]=>
string(121) "Unsere Leistungen im Überblick: Software und Consulting-Services von der Datenintegration bis zur fertigen BI-Anwendung."
["post_status"]=>
string(7) "publish"
["comment_status"]=>
string(6) "closed"
["ping_status"]=>
string(6) "closed"
["post_password"]=>
string(0) ""
["post_name"]=>
string(10) "leistungen"
["to_ping"]=>
string(0) ""
["pinged"]=>
string(0) ""
["post_modified"]=>
string(19) "2024-07-25 17:36:00"
["post_modified_gmt"]=>
string(19) "2024-07-25 15:36:00"
["post_content_filtered"]=>
string(0) ""
["post_parent"]=>
int(0)
["guid"]=>
string(39) "https://www.bissantz.de/?page_id=107838"
["menu_order"]=>
int(0)
["post_type"]=>
string(4) "page"
["post_mime_type"]=>
string(0) ""
["comment_count"]=>
string(1) "0"
["filter"]=>
string(3) "raw"
}
Dr. Ulrike NeubauerzwissTEX
„Ganze zwei Tage hat Bissantz für den Aufbau des initialen Datenmodells benötigt.“
Andreas WüstAlmatec
„Abweichungen lassen sich sofort erkennen und ergründen – ad hoc und übergreifend aus verschiedenen Datenquellen.“
Matthias KrebsVoith
Johanna GärtnerWENCO
Carlo BearthWürth International
Thomas SchenkirschAebi Schmidt
Carsten DeeckeDierkes Partner
[dynamic_columns id='134501' title='Zusätzliche System Navigation']
Ludwig StüweLinxens
Melanie RosenbergerScherdel
Patrick TemeschinkoVoith