![]()
Greetings, fellow data analysts!
Companies spend a great deal of time and effort collecting, saving, preparing, and consolidating data – and, ultimately, making reports. But if a report is read and understood or even triggers a reaction doesn’t just have to do with the quality of the underlying data. The design plays a key role as well. When it comes to designing reports, DeltaMaster already answers many open questions and takes over a range of tasks, for example, through reasonable default settings, automatic formatting, and a carefully defined set of options. And for all of the tasks that you can’t automate (yet), we have set up recommendations and guidelines. We will present these to you as a series of checklists and explanations in a special edition of DeltaMaster clicks!:
Part 1: General Guidelines DeltaMaster clicks! 09/2013
Part 2: Pivot tables, graphic tables DeltaMaster clicks! 10/2013
Part 3: Sparklines, pivot Charts DeltaMaster clicks! 11/2013
Part 4: Nomenclature DeltaMaster clicks! 01/2014
You will see how you can make many improvements to your reports with very little work. Oftentimes, all you need to do is tweak a few settings to make your reports more attractive and easier to understand. The readers of your reports and audience during presentations will surely thank you.
Best regards,
Your Bissantz & Company team
The fourth and final part of our series on improving DeltaMaster applications deals with names, captions, labels, and notations. You can choose the names of all objects that you create in DeltaMaster, such as reports, cockpits, folders, measures, calculated members, and named sets. In addition, you can change the way that the numbers are displayed as well. These freedoms are meant to be employed well. We’ll explain how in the following tips:
| Nomenclature
1) Remove underscores 2) Do not call key figures “measures” in your applications 3) Remove “no trend” messages from trend barometers 4) Do not repeat the report type in the title 5) Check decimal places 6) Scale large values 7) Use unambiguous, plausible names 8) Use the shortest understandable form 9) Display descriptions instead of names in selection lists |
1) Remove underscores
Please spare your readers the underscore! The underscore (“_”) annoys while reading, it is ugly and above all: unnecessary. In DeltaMaster, you can use spaces in all names and descriptions – including folders, cockpits, measures, calculated members, named sets, and much more, even names of files and applications in the repository. Names such as “GM_II”, “Sales_Plan_Branches_Start_final2” or “Revenues_Net_International” are unacceptable for readers.
Underscores are only important on the back end – for example, in Web addresses (URLs), the names of functions and variables in programming languages, or other technical names that do not support spaces. They are not used as punctuation, letters, or characters in natural language. If you still encounter underscores, you could assume that the author probably was thinking more about his technology than the recipients of the report. User-friendly applications, however, are supposed to serve as a buffer between man and machine to minimize the complications of technology.
Omitting empty spaces or punctuation and designating new words through capital letters (e.g. “SalesEurope” or “Db2Eur”) is another bad naming habit. These notations are difficult to read and completely unnecessary.
To put it in plain English: DeltaMaster supports spaces in all names and descriptions – with no negative side effects. This also applies to punctuation (e.g. parentheses, slashes, commas, colons), foreign language letters (e.g. tildes, umlauts), and special characters (e.g. mathematical symbols). You can even use names with these types of characters in MDX statements. The only characters that have a special effect in MDX are curly or angle brackets (e.g. “{cp}” or “<viewX>”). DeltaMaster will treat these as variables and replace them with member names or values.
In short, please use plain-old English (or the language of your choice) whenever you are writing names or descriptions. Don’t be afraid to use spaces and special characters – and forget about underscores.
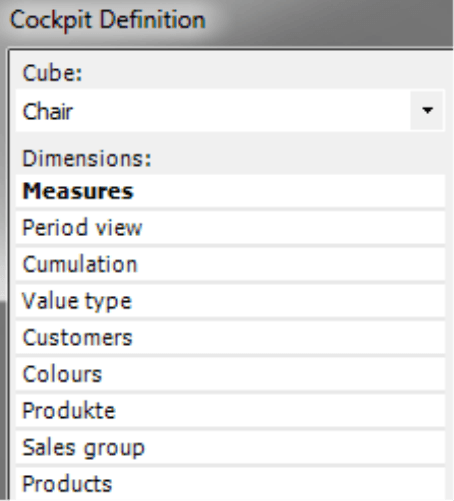
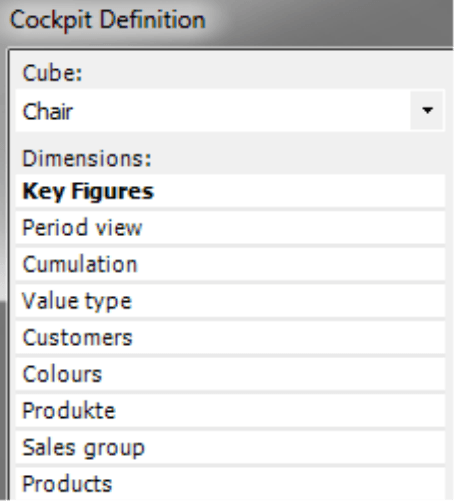
2) Do not call key figures “measures” in your applications
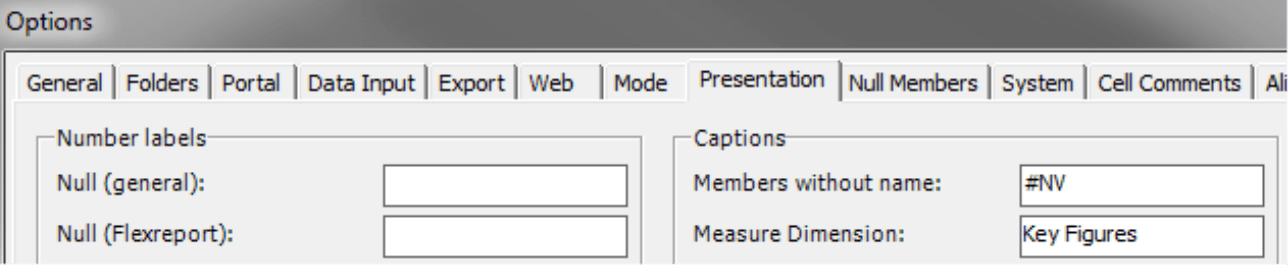
A measure is a term used to describe attributes of a special dimension in database models. When you are building reports for business users, however, you should strive to use the same names that they use internally. Your reporting applications should translate technology into the language of your users and consumers. When managers talk about “measures” in business, they are thinking of further actions. What we refer to as measures in DeltaMaster or the data model are probably called KPIs, key figures, metrics, ratios, etc. in your company. So give your “Measures” dimension the same name that your managers use – for instance, “Key Figures”.
 |
 |
You can change the name of the Measure Dimension in the Options (Extras menu) on the Presentation tab.
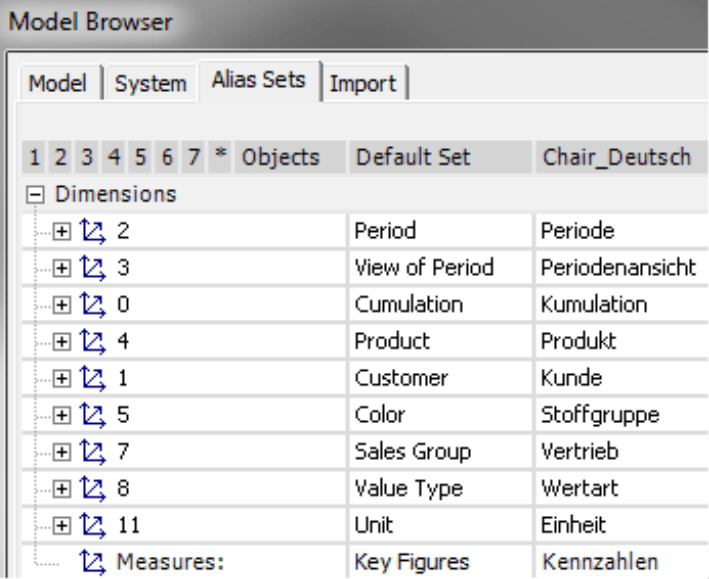
In multilanguage applications, you can define the term for each language in an alias set. Open the Model Browser (Model menu) on the Alias Sets tab and enter the desired terms for the Measures at the bottom of the Dimensions section.
The name of the measure dimension should not appear in most reports anyway. In the second part of our check list for DeltaMaster applications, we recommended hiding hierarchy names in pivot tables – especially in axes containing the measure dimension (see DeltaMaster clicks! 10/2013, tip #1).
3) Remove the “no trend” message from trend barometers
The trend barometer offers additional analytic insights for sparklines (see DeltaMaster clicks! 11/2007). When this option is activated, DeltaMaster will run a regression calculation for the time series displayed in the sparklines and display the resulting trend as a small symbol following the sparkline. If it identifies a trend in the statistical sense, DeltaMaster will designate its direction and strength with an arrow. If it doesn’t, DeltaMaster will display “nt” for no trend.
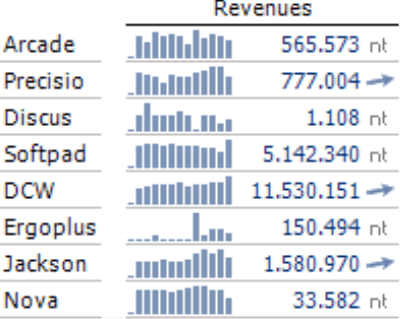 |
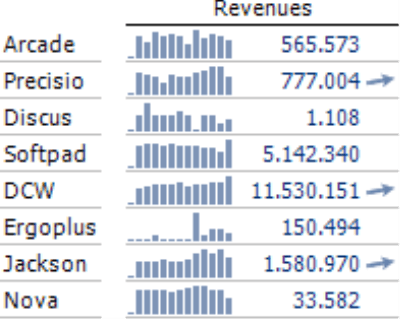 |
In many applications, no trends are prevalent. In fact, real trends are rare – and, therefore, something special that you should highlight. As a result, it makes sense to hide the “nt” message as shown in the second visualization above. That way, your readers can instantly identify the few cells that actually show trends instead of dwelling over the countless ones that do not.
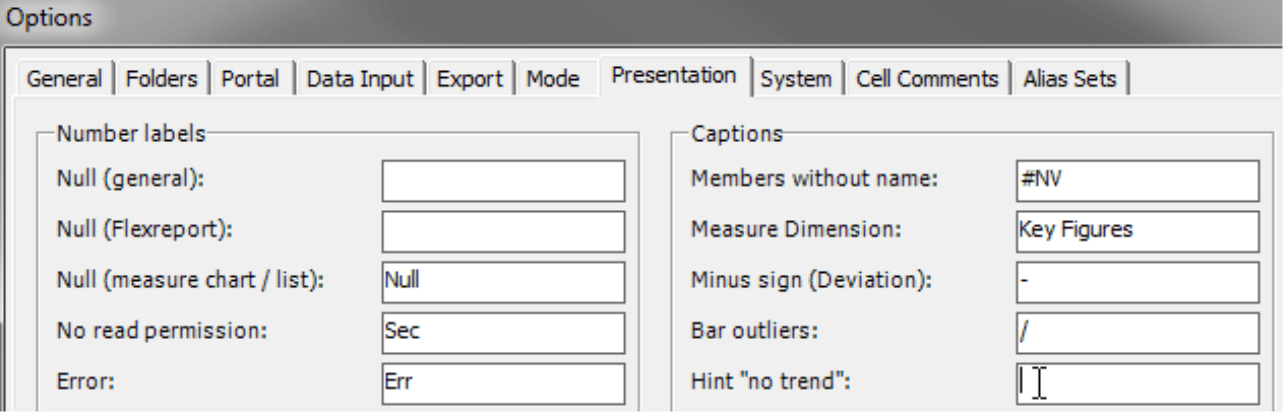
To hide this hint, you change the text that is displayed in cells with no trend in the Options (Extras menu) on the Presentation tab. When this field is empty, DeltaMaster will not display a hint if it has not detected a trend.
4) Do not repeat the report type in the title
DeltaMaster displays three small letters as a symbol in front of each report in the Briefing Book. These three letters, which designate which analytic method is used in the report, are intuitive to understand. GEO stands for Geo Analysis, PFL for Portfolio Analysis, RNK for Ranking, TIM for Time Series Analysis, and so on. Accordingly, there is no need to include the name of the analytic method in the report name. This simply makes the name longer, which wastes more space in the Briefing Book window without providing any additional information.
Rather use that space to list which dimension is applied to the analysis or which measure is being viewed.
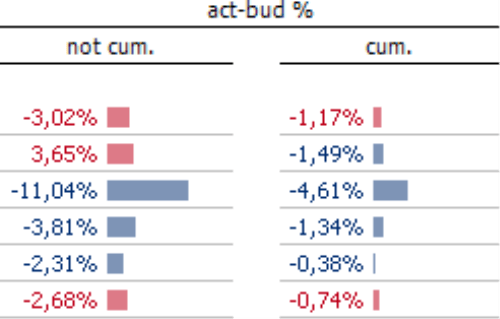
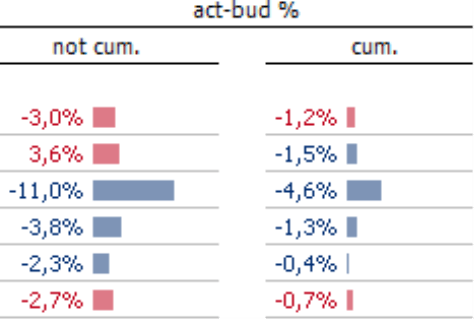
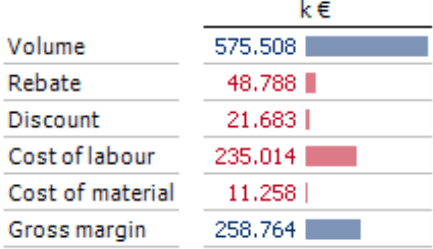
5) Check decimal places
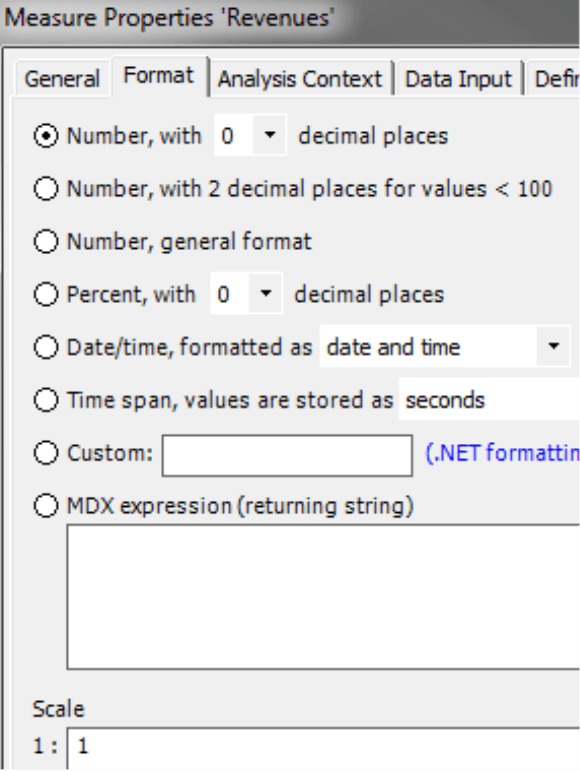
When you create a new measure, DeltaMaster will automatically suggest Number with 0 decimal places as the format (Measure Properties, Formatting tab) – provided that a format has not already been defined in the database. In most cases, this is the best formatting option.
In management reports, for example, you do not need to list revenues, costs, etc. down to the last cent. Therefore, you can also remove the decimals. Older DeltaMaster applications, however, may still use another format which automatically uses two decimals places for values less than 100 and none for values over 100. This automated format is designed for special applications, for example, in the field of market research. Normally, you should always use a fixed number of decimal places. Our recommendation, therefore, is to check if you can eliminate the decimal places all together. This almost always applies to absolute measures with no further scale (see tip #6 for further information).
When you are working with variances as percentages, shares, and other proportional measures, no decimal place is necessary – and if so, a single one will generally suffice.
 |
 |
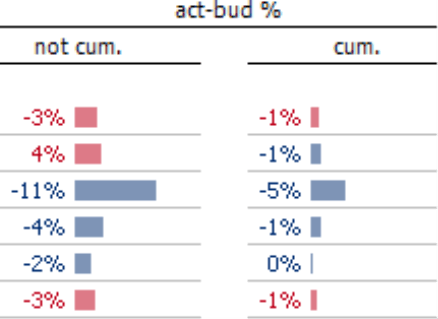 |
In the case of variances, the format is often defined in the calculated members of the “value type” or “period view” dimensions – and not the measures.
Prices, shares, and currency rates, however, are a clear exception to this rule. These decimal places can be very relevant in these examples because they are generally multiplied by a quantity and, therefore, even small differences behind the decimal point can quickly result in major differences in front of it.
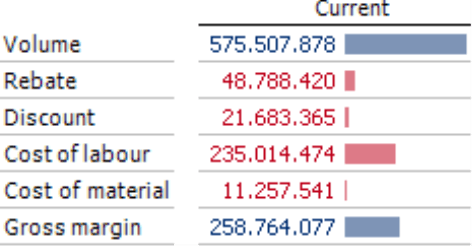
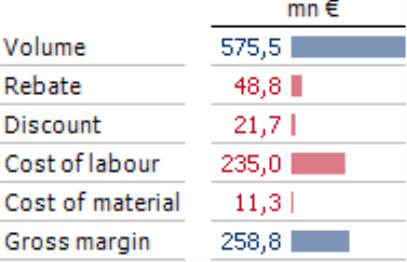
6) Scale large values
Check if and where it makes sense to scale your measures. In many cases, you could simply list revenues and costs in thousands or millions. This makes the numbers easier to read and understand while saving valuable space in the report.
 |
 |
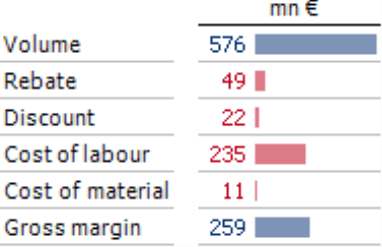 |
There are many different ways to scale measures. In the Measure Properties on the Formatting tab, for example, you can define the Scale for each measure (e.g. “1:1000”; see screenshot in tip #5). Another option is to create multiple measures in different scales, e.g. “Revenues (k)” and “Revenues (mn)”.
If you are using a scale in millions or even billions, you may wish to format the numbers using a decimal place. To simplify the process of scaling and formatting numbers, you can save the settings as format templates which you can use over and over again (see DeltaMaster deltas! 5.3.5, feature #2).
Alternatively, you could also create scales as calculated members. You can flexibly arrange them in pivot tables and they apply to all measures that can be combined with calculated members. For this purpose, you could create a separate “Scale” dimension in the data model. If the data model doesn’t contain this dimension, you can also create a scale member in the period view or another utility dimension if necessary.
You can also use MDX to dynamically scale measures depending on the view. This allows a global corporation to calculate group revenues in billions while its subsidiaries can work in terms of millions and individual sales regions in thousands. For more information on how to configure a dynamic scale, please read DeltaMaster clicks! 02/2008. This issue also contains many tips on formatting numbers.
7) Use unambiguous, plausible names
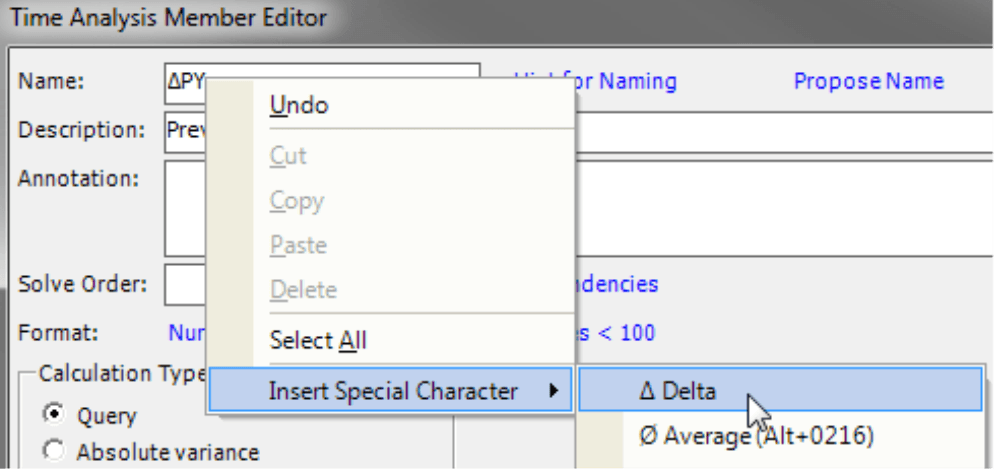
Choose names that describe the purpose of a measure or member as clearly as possible. You could name a time-series member that calculates the variance from the previous period so that it automatically shows which periods are being compared – for example, “Nov 2013 ./. Nov 2012”. For more information on time analysis members and working with variables, please read DeltaMaster clicks! 08/2007.
Many DeltaMaster users appreciate these types of notations because they can quickly see which time periods have been calculated. On the other hand, this type of name is not exactly easy to read as a column heading. One way to test different names is to read them out loud in entire sentences, in other words, in the respective context. In a presentation, you would probably never say: “The difference between November 2013 and November 2012 totaled …” Instead, you would talk about the variance to the previous year. “Variance to the previous year” and “Variance Previous Year” are good names but they are rather long as well. In the case of time comparisons, however, you can use abbreviations because they are common in reporting and easy to learn. Some examples include: “Var. Prev. Year”, “Var. PY”, or “?PY“.
Delta, a mathematical sign that represents change, is a good symbol to use in reports that primarily deal with differences and variances. You can easily add this symbol in DeltaMaster. In the context menu of the data entry field for names, you can choose an option to Insert Special Characters including delta, average, and other useful symbols.
8) Use the shortest understandable form
The golden rule for naming measures and calculated members is: as little as possible, as much as necessary. In other words, you do not need to write out “Gross margin” or “Earnings before interest and taxes” when the abbreviations “GM” and “EBIT” are clear, commonly used, and concise – thereby, saving valuable space. You should also remove any words that do not provide additional information. If you shorten “Total revenues” to “Revenues”, everyone will still know what you mean.
In DeltaMaster, you can add a Description to measures, calculated members, time analysis members as well as edited dimension members to document what the shortened term means.
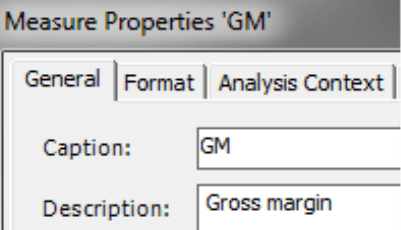
DeltaMaster will then display this description as a tooltip when you mouse over the name of a measure or dimension member. These tooltips provide a comfortable, discrete way to provide additional information.
![]()
Since measures and dimensions that are saved in the database do not always have short, unique, and plausible names, DeltaMaster offers various ways to edit them. You could, for example rename measures or enter an alias for dimension members (see DeltaMaster deltas! 5.5.1, feature #17). Both approaches affect the entire analysis session or application. In addition, you can individually change the description in each individual pivot table (see DeltaMaster deltas! 5.5.5, features #12 and #13).
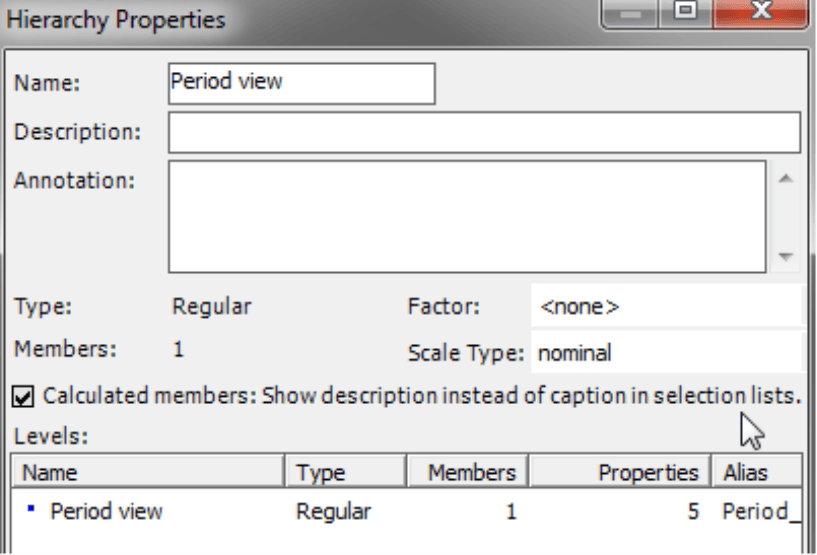
9) Displaying descriptions instead of names in selection lists
Tip #7 recommends that you check the names of calculated members and, in particular, really ask yourself if you should use variables for time references (e.g. “?PY” instead of “Nov 2013 ./. Nov 2012”). If you still opt to use variables in member names, they should be easily recognizable as such.DeltaMaster replaces these variables in a report so that your readers do not see them. In the default setting, however, DeltaMaster will display them in drop-down lists such as in the Dimension Browser or the View window because they are part of the name. And in this case, only an experienced user would understand what a term such as“{cp} ./. {pya1,1}” means.
You can address this issue by activating a setting in the Hierarchy Properties (I want to menu in the Dimension Browser).
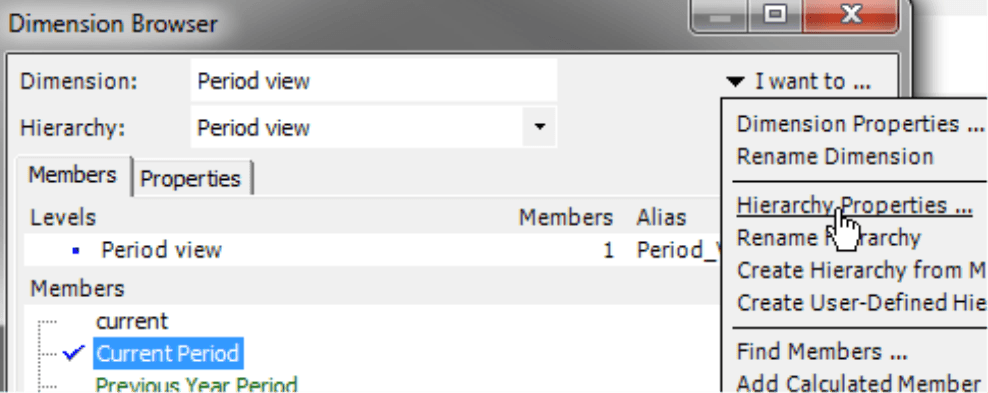
Here you can define that DeltaMaster should Show [the] description instead of [the] caption in selection lists.
With this option you can continue to use variables in the names of calculated members. When a report is displayed, DeltaMaster will replace these variables with the respective attributes. In the user interface, however, DeltaMaster shows the descriptions which, of course, need to be maintained with care.
Questions? Comments?
Just contact your Bissantz team for more information.
