![]()
Greetings, fellow data analysts!
In a road atlas, it is a matter of course: You can view all of Europe as well as individual countries, metropolitan areas, cities, and detailed downtown views all in the appropriate scale. Depending on where you are headed and where you are right now, you simply select one page or the other – or even flip between the two at times, depending on whether you need to see the big picture or more detail. In management reporting, however, finding the right scale for graphics, charts, and even plain numbers is surprisingly difficult. What should we display in billions, millions, or thousands – and what down to the very last cent? Many times, that depends on the concrete KPI or report. But no matter what that scale may be, you can depend on DeltaMaster to consistently apply the proper formatting across your entire application.
Best regards,
Your Bissantz & Company team
Financial controlling is not accounting. Rarely do you need to present amounts down to the last cent – and if you do, the reports often become difficult to read as a result. A better option is to display amounts such as revenues in thousands or millions. This makes the numbers smaller so that the human eye can process them more easily. Horizontally, it also saves space which you can use for other important things or leave empty.
DeltaMaster offers two ways to format values in this manner and configure them to be displayed in thousands or millions. You can:
- Define the format of each measure separately in the respective Measure Properties.
- Create a format that applies to several measures using Calculated Members.
Formatting measures
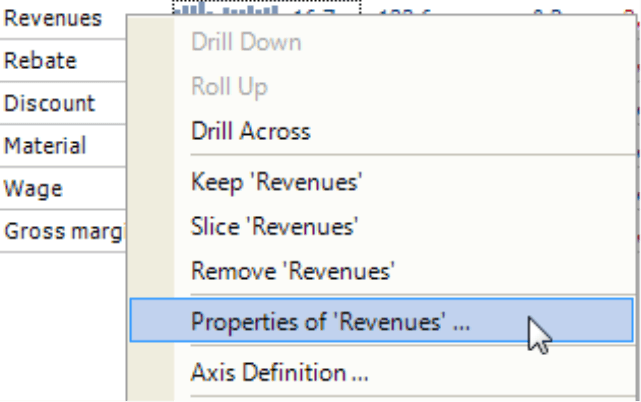
You can customize how DeltaMaster should format numerical values in the Measure Properties. To open this dialog box, double click on a measure in the Measure Browser (Model menu) or use the respective entry in the context menu of the measure’s name directly in a report or cockpit.
The Format tab contains all of the options you will need. In the default setting, DeltaMaster will simply transfer the format from Microsoft Analysis Services (see DeltaMaster deltas! 5.5.8, feature #4). You can also administer this format in DeltaMaster Modeler. To format the values in thousands or millions, go to the Scale field in the bottom part of the dialog box and enter “1:1000” for thousands or “1:1000000” for millions. In addition to the Scale, select the formatting option Number, with 0 decimal places – or one decimal place at most. This ensures that you really eliminate some of the digits and do not just move the decimal point around. If you are working with values in thousands, no decimal places are usually necessary. In the case of millions, however, it makes sense to use one decimal place.
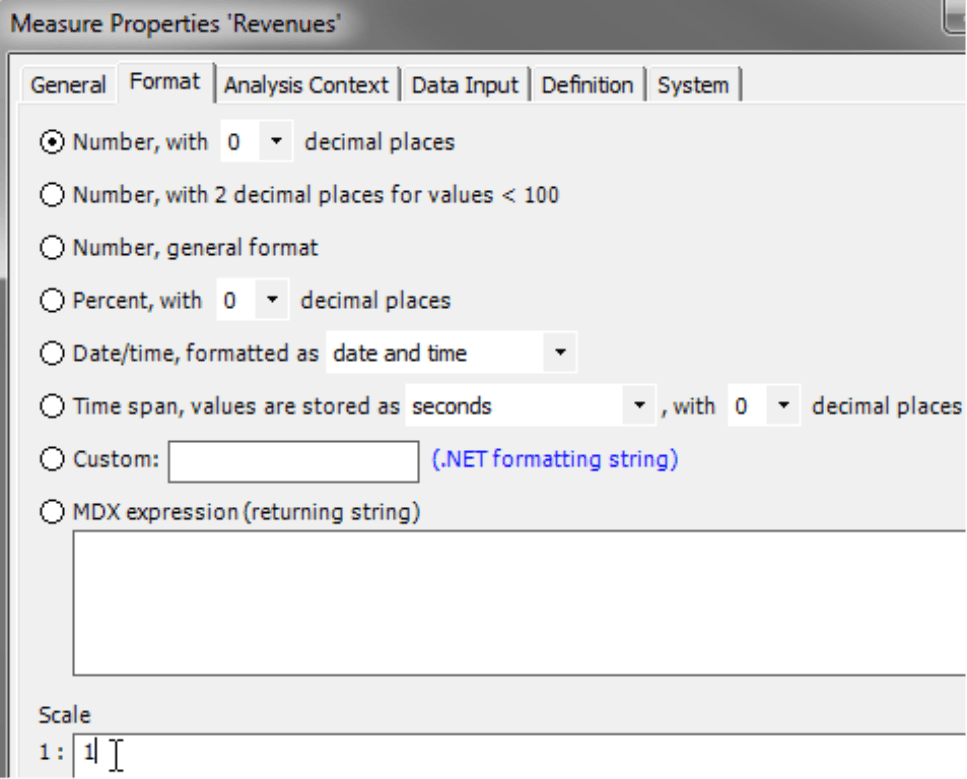
This Scale only affects how the numbers are displayed. DeltaMaster will use the complete number in all calculations including variances as percentages and quotients of scaled values. If you export a scaled value to Excel, DeltaMaster will first export the entire number (i.e. including all digits) and then apply the same format as in DeltaMaster. This only works, however, when the scale is based on a power of ten (e.g. 1:10, 1:100, or 1:1000). Other scales are not supported.
Alternatively, you can also set the format using a .NET Formatting String. The format here is “#,#,” for thousands and “#,#,,” for millions. Both character strings will suppress decimal places and group the values by thousands. In contrast to the Scale, however, the values will change when you export them to Excel. For more information on .NET Formatting Strings, please read DeltaMaster clicks! 02/2008.
One measure per scale
Changes to the measure’s formatting will affect every cockpit, analysis, and report throughout the entire analysis session. Depending on the context of the report, however, you may want to display a measure in millions, thousands, or even down to the last cent. For example, you might want to show annual revenues for different countries in millions, monthly revenues with individual customers in thousands, and daily revenues with a certain article without any scale at all.
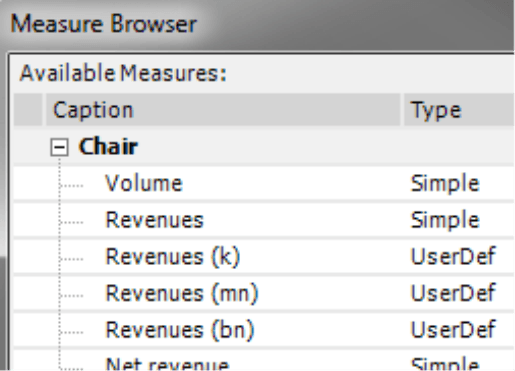
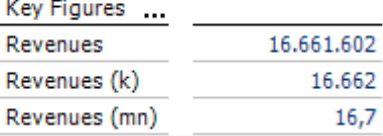
Many DeltaMaster users address these needs by creating “copies” of the same measure and applying different formats such as “Revenues (k)” and “Revenues (mn)” to each one.
To copy a measure, follow these steps:
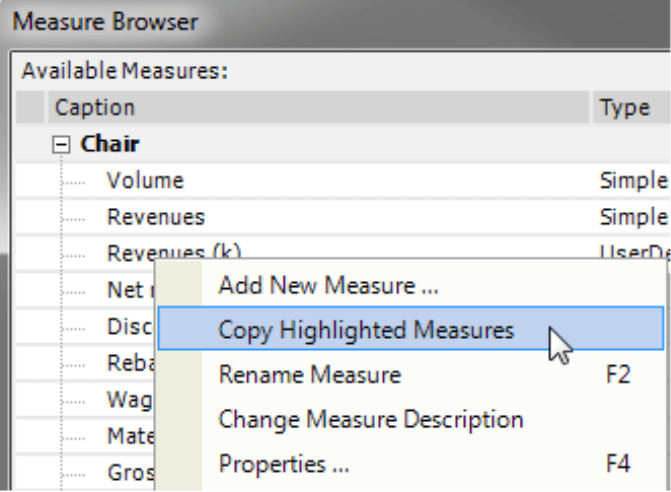
- If wish to copy a filter measure, user defined measure, or another measure that was created in DeltaMaster, open the Measure Browser (Model menu), select that measure, and Copy it using the respective option in the context menu. In the Properties of the copied measure, you can now change the format (as described above) and name (e.g. “Revenues (k)” instead of “Revenues (Copy)”).
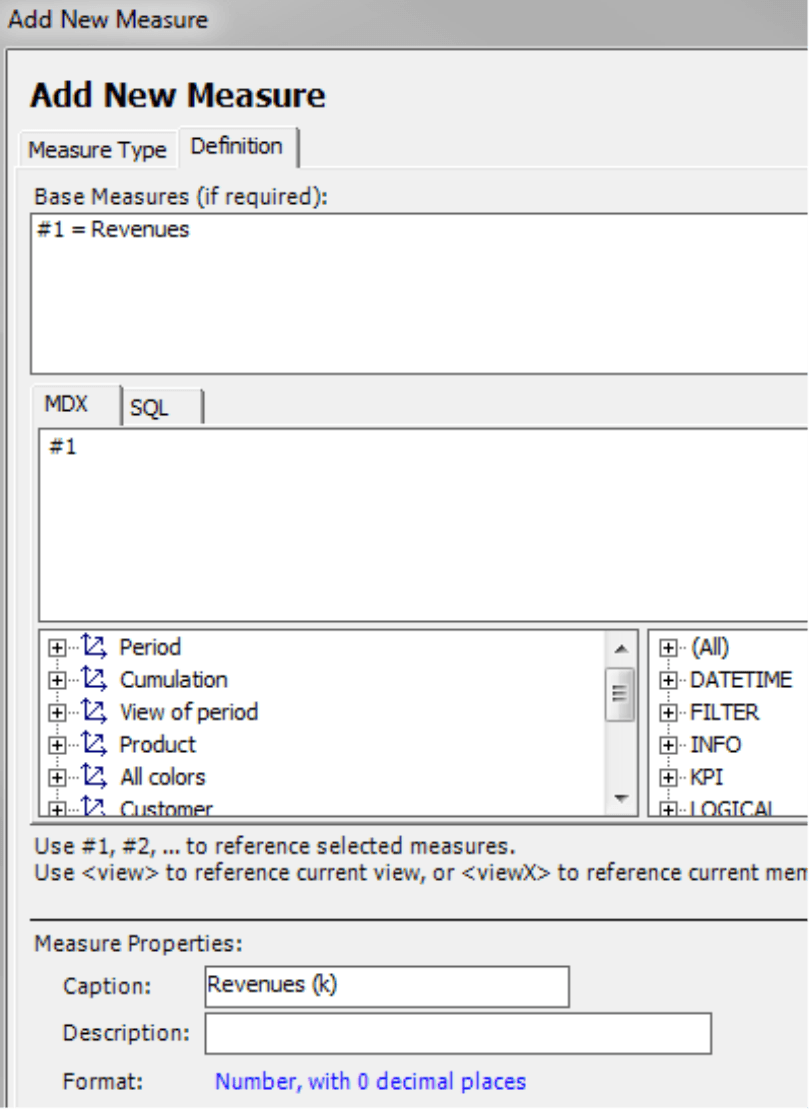
- If the measure stems from the database (Type “Simple”), you cannot copy it from the context menu. In this case, you will need to add [a] new measure (I want to menu or context menu in the Measure Browser).On the Definition tab (see following screenshot), select the measure that you wish to copy as the Base Measure. Now enter this measure using the wildcard “#1” in the MDX expression and caption it.
In the screenshot on the right, you can see that “Revenues” is selected as the base measure and “#1” is placed in the MDX expression. This statement simply returns the base measure as it is. You can now change the format of this copy as described above by opening the Measure Browser from the Properties of the newly created measure and entering the desired Scale. (Please note that you cannot access this setting from the Format link, therefore, you need to open the Measure Browser a second time.) If you need further copies of the base measure, you can create them using the copy function in the context menu of the first copy, as explained above.
Aside from the “1:x” scale and the formatting character string in the Measure Properties, there is technically a third way to define a scale when you add a user defined measure. This method divides the base measure by a thousand or another devisor in the MDX statement (e.g. “#1/1000”). In this case, however, the scale will affect the display as well as all other calculations, in which this measure occurs, for example, average prices or revenues per square meter. In other words, this method changes both the presentation and calculation logic. As a result, you should only use it if you really intend to make a standard conversion, for example, to convert precious metals in current assets from troy ounces to grams.
Using differently scaled measures, you can design your reports to meet specific requirements.
Measures with a view-dependent scale
In some cases, you can set the scale so that it is dependent on the View and, therefore, automatically changes with the report context. A global corporation, for example, can then calculate in billions on a group level, in millions on subsidiary levels, and in thousands for sales regions. In the Measure Properties, you can define an MDX expression to automatically set the Scale. Please read DeltaMaster clicks! 02/2008 for more information.
Formatting with calculated members
Copying measures is a good solution when you need to have different scales only for a few measures. If you require different scales in many measures, working with calculated measures is the more practical alternative. You can apply these simultaneously to several measures or to all values in a report. This works similarly to utility dimensions such as the “View of period” or the “Scenarios” in which you define calculations that apply to all measures.
In order to set the format using calculated members, you first need a utility dimension in which you can create the calculated members. For this purpose, you should create a separate dimension in the OLAP database – for example, “Scale” or “Unit” as in our reference model. If the database does not contain a separate dimension, you could theoretically define the calculated members in another (utility) dimension. Please note, however, that you cannot combine scale members with other members of the same dimension. For example, you cannot apply a scale member to a variance from the previous year if they both are located in the “View of period” dimension.
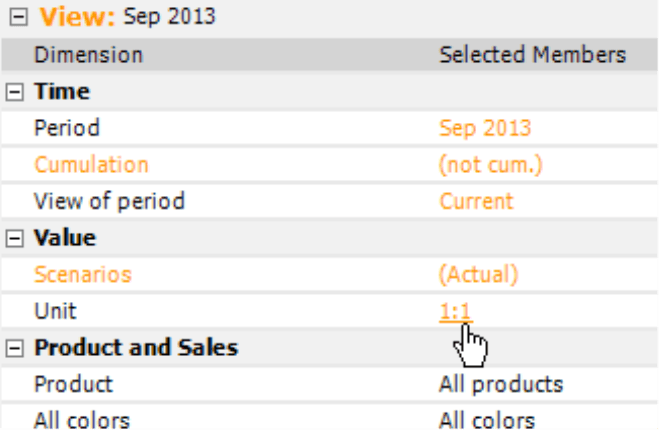
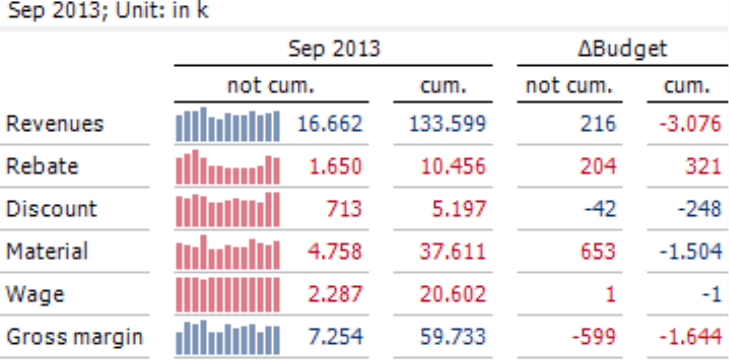
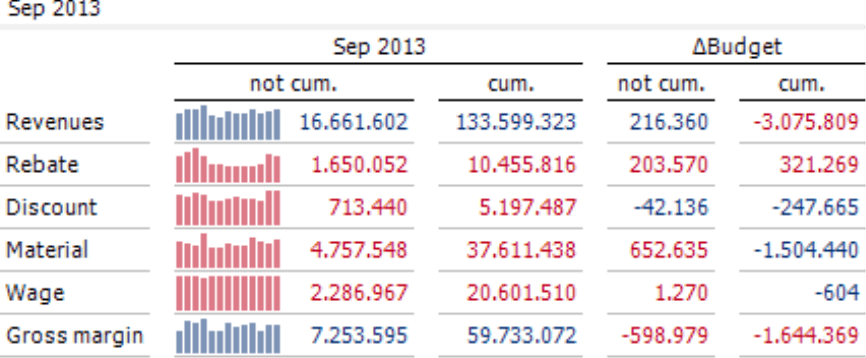
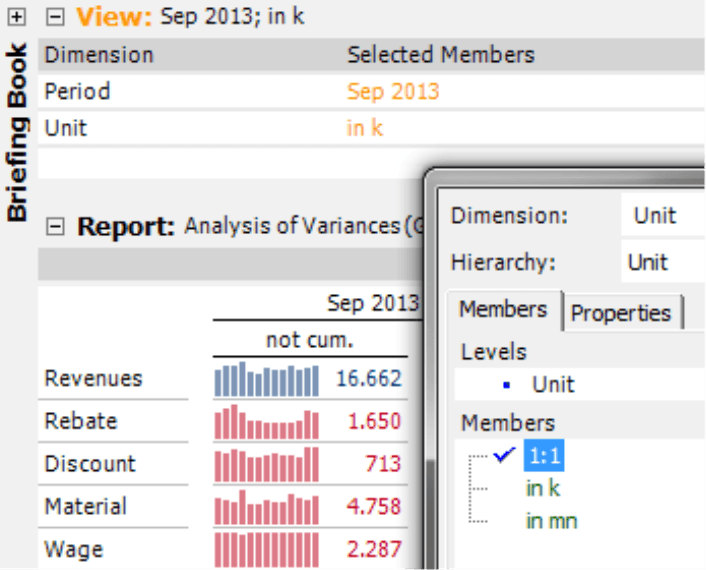
In the database, all you need is a single member that does not scale the values. In our example, this member is called “1:1”. This is a standard member such as “Actual” in the “Scenarios” or “Current” in the “View of period”. We recommend that you hide this member name as well as the hierarchy level “Unit” in the view description because they do not provide any additional information. Please read our Checklist for DeltaMaster Applications (DeltaMaster clicks! 09/2013, tip#2) for more information.
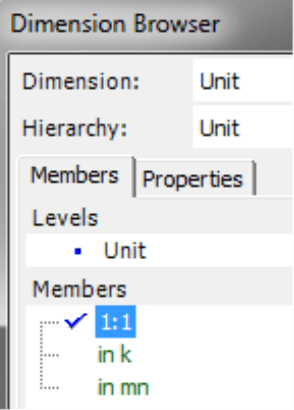
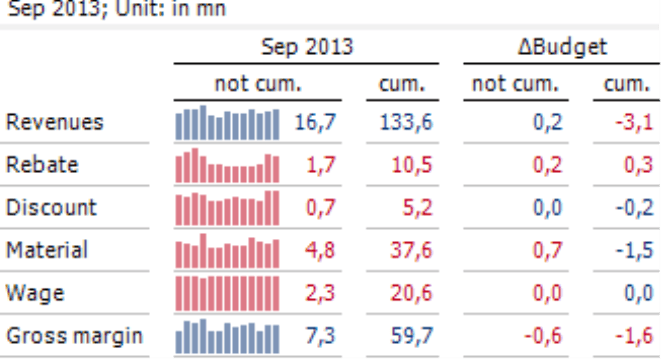
In the picture above, you will also see in addition to the reference member “1:1” the calculated members “in k” and “in mn” where the scale has been implemented. You can create them in the Dimension Browser by opening the I want to menu or the context menu and selecting Add Calculated Member.
Here you also have two possibilities to configure the scale: either by using division in the MDX statement (similar to the way described in the user defined measures) or formatting with the .NET formatting string. A “1:x” scale is not available in the Calculated Member Editor.
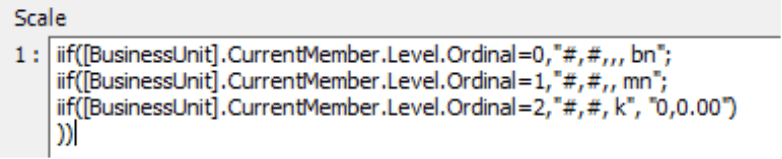
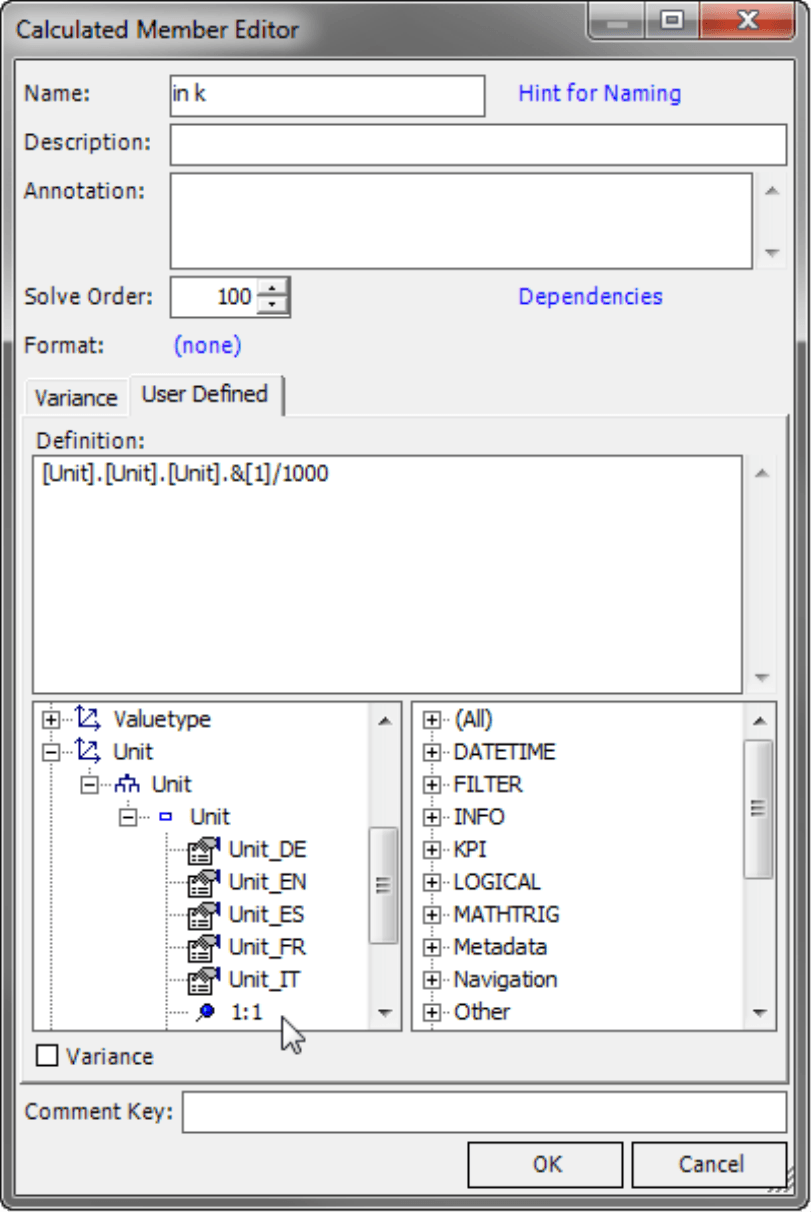
- In the MDX statement (see screenshot below), the reference member (in this example, “1:1”) is divided by the desired scale factor. In MDX language, this member of our model is called “[Unit].[Unit].[Unit].&[1]”. To enter this name, use the browser in the bottom-left side of the dialog box. If you double click on the name of the member, DeltaMaster will transfer its MDX name into the text field. The slash behind the reference member stands for the division operator. After that, the divisor “1000” is used to calculate the scale.
Please also check the Solve Order. It should have a low value (e.g. 100 or less) so that the scale is calculated at a very early stage. Otherwise, it can lead to incorrect results in variances. If a report containing scale and variance members displays results that are too small, always check the Solve Order first.
With Format, you can also change the number of decimal places as in measures. Since calculated members do not have their own formatting in the default setting, DeltaMaster will apply the number formatting from the measures (and possibly from further members that affect a table cell).
- Instead of using division, you can also generate the formatting using a .NET character string such as “#,#,” or “#,#,,” as described above for formatting measures. In this case, enter the reference member in the definition of the calculated member and set the desired Format.
Now you can access several calculated members that you can combine with measures and other members.
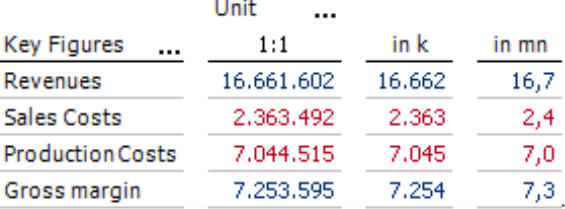
Scale per report
As you can see in the screenshot above, the advantage of formatting with calculated members is that you can apply them to several measures without having to create individual format variations. You can use this same approach to format an entire report in one step. Users working in Viewer mode benefit from this approach as well because they can set the scale in the View window and, therefore, can switch between exact and easy-to-read views to select the presentation that best meets their needs.
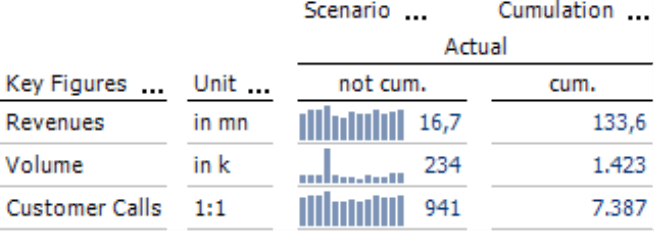
Scale per row or column
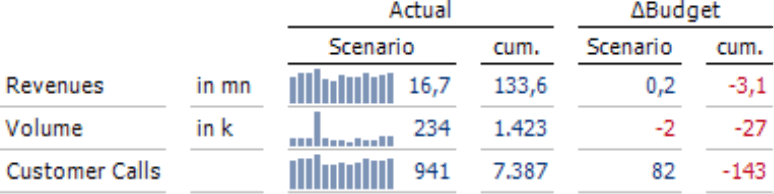
Selecting a scale that affects the entire report can be a great relief. Yet it also has its drawbacks – especially when a report contains different measures whose values have different dimensions by nature. The furniture manufacturer from our “Chair” reference model, for example, would probably measure revenues in millions, units sold in thousands, and each customer call separately. In your company as well, you will probably often need to use multiple scales in one and the same report.
In situations such as these, use the Column/Row Editor to assign the appropriate scale to each measure or member. Place the scale dimension (e.g. “Unit”) in the axis as well and nest it with the measure dimension (or another dimension in which the scale is dependent on its members).
In the case of nested dimensions, you can use the Column or Row Editor in the Axis Definition to create individual combinations of attributes in which one or more members from each involved dimension are selected. You can use this feature to assign the appropriate scale to the measure. To learn more about the functions of the column/row editor, please read DeltaMaster clicks! 01/2009.
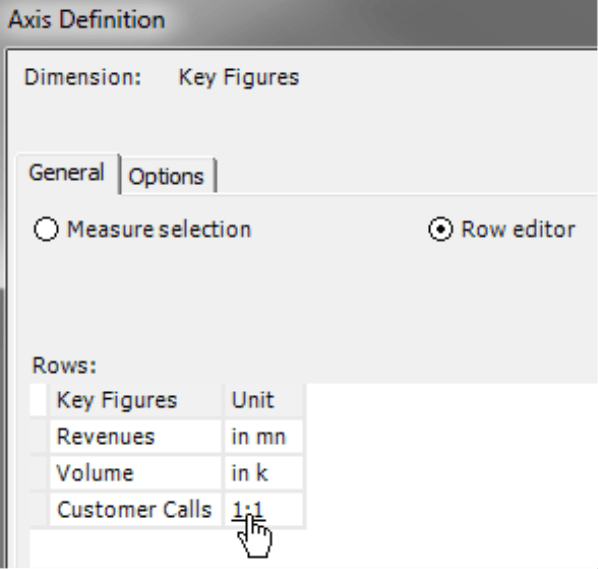
As of DeltaMaster 5.5.5, you can enter report-specific names for members and measures in the column/row editor. You can use this function to leave the field empty and, thereby, remove the awkward caption “1:1”. You can learn about more new functions for this editor in DeltaMaster deltas!. Simply open DeltaMaster Help (F1 key or Help menu) and search for the Keyword “Column/Row Editor”.
By hiding “1:1” and the Hierarchy Names for Rows and Columns in the Table Properties, you can create a fine collection of KPIs with individual scales that you can easily extend and reuse in the future.
Summary
This edition of clicks! has shown how you can format values in thousands or millions to improve the readability of reports.
- If only a few values are affected, work with measures in different formats. You can define these in one of three ways: using a “1:x” scale, .NET formatting string, or (in the case of user defined measures) MDX division. We generally recommend using the “1:x” scale.
- If many values are affected or the report consumers in Viewer mode should be able to change the scale, use calculated members in a separate scale dimension. You can scale them in one of two ways: using a .NET formatting string or MDX division. We generally recommend using MDX division. In this case, please ensure that the “Solve Order” is low.
In the Axis Definition of pivot tables, you can select which measure – and, therefore, which formatted measure – DeltaMaster should display. With calculated members, you can either set the format for the entire report or combine them in the column/row editor to assign the appropriate format to certain measures or members.
Questions? Comments?
Just contact your Bissantz team for more information.
