![]()
Greetings, fellow data analysts!
For more than 5 years now, Bella’s blog has been a source of inspiration for all those interested in examples of the correct way to work with and visualize data. To date, our office dog has posted well over 100 entries. Most times, she makes observations on graphics taken from the media, draws her conclusions, and derives rules for better visualization. These examples are genuine and therefore prove to be tricky time and time again. Creating an eye-pleasing graphic doesn’t take long, especially if the designer picks and chooses the data. Real data, however, is a bit wilder. Outliers, gaps, jumps, and different levels make our work more complicated. In this issue of DeltaMaster clicks! we will take you into our blog’s editorial office and show how we help Bella once she has sniffed out a new case. With the help of DeltaMaster, we will prepare and analyze the data, test different alternatives, and do whatever is necessary to get the real message across in a way that you understand.
Time and time again, we realize how convenient it is that we can explore our data from so many different angles thanks to the tightly interwoven methods and functions that DeltaMaster provides. This time, we will take a closer look at a common problem: displaying multiple time series. At the same time, our little tour shows you how you can rely on DeltaMaster’s multiple tools even when you are working in unfamiliar territory. Come along and join us!
Best regards,
Your Bissantz & Company team
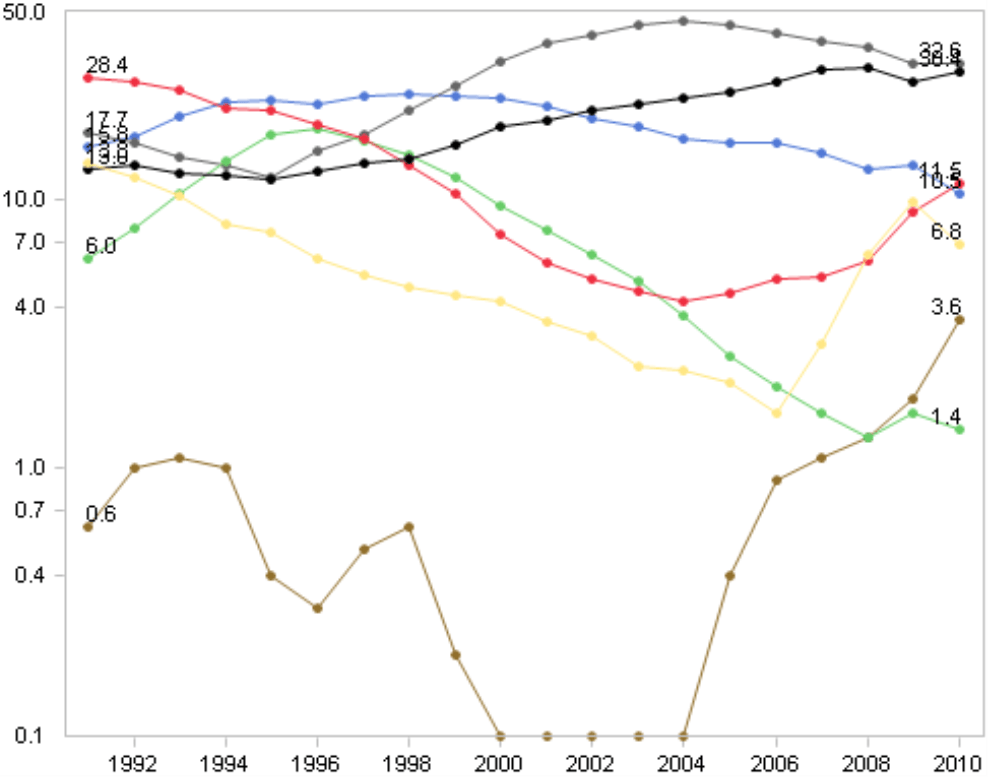
Let’s take a closer look at the line chart from the 27 November 2011 edition of Die Welt. This graphic shows how the seven most popular car colors in Germany have changed over the past 20 years – with each color displayed as a percentage of all new car registrations for the respective year. So…what’s your impression?
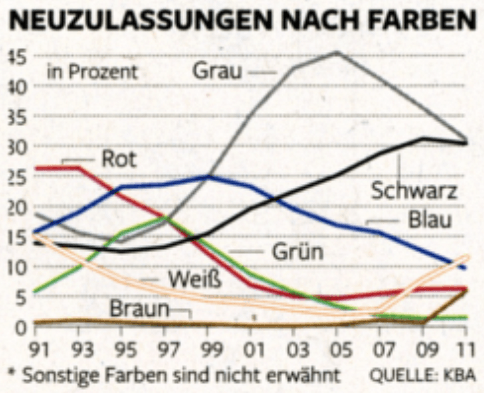
“Pretty spaghetti-ish to me” is how Bella describes it in her blog. The jumbled lines are hard to read and hard to understand. The chart has no room for the actual values and the labels are just floating around haphazardly in space. You can find similar data constellations in financial controlling time and time again: multiple developments over time needing to be reported and analyzed, whether it’s market research data (as seen above), revenues from different regions, or the EBIT for individual subsidiaries in the group.
Let’s use this example from Bella’s blog to discuss how you can tackle developments over time using the standard tools offered in DeltaMaster.
Preparation: Collect and dice the data
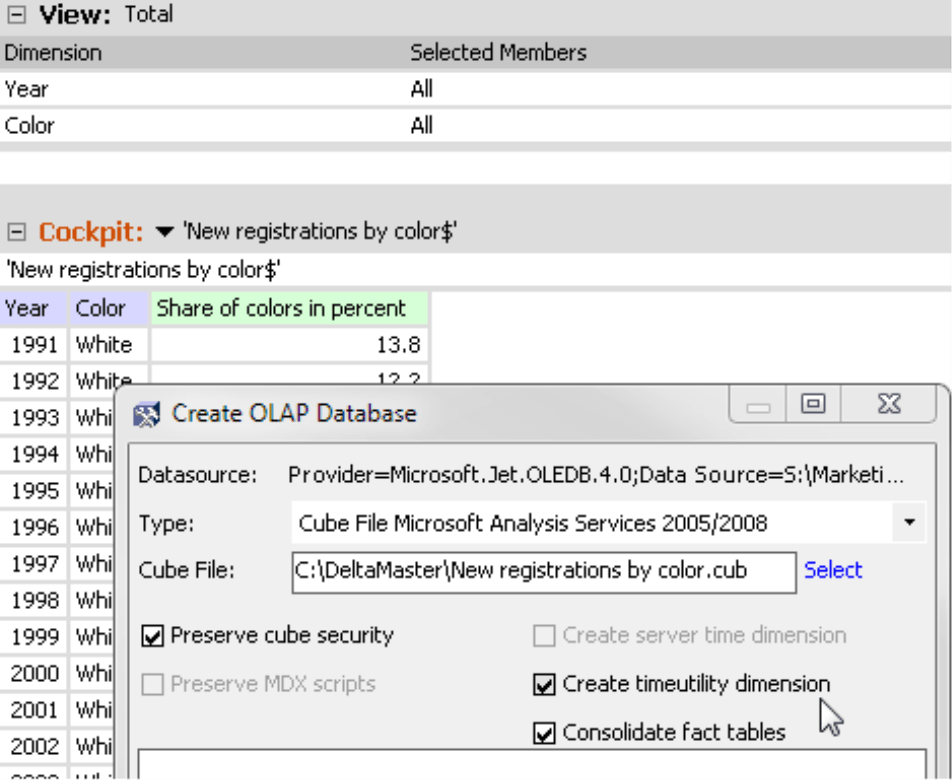
The data for the chart on the front page stems from the German Federal Motor Transport Authority (www.kba.de). We copied this data into an Excel file and generated a local cube file using DeltaMaster TableWizard and DeltaMaster CubeWizard (see DeltaMaster clicks! 04/2010).
The analysis model consists of two dimensions (i.e. the years and colors) and a measure (i.e. market share). You can generate these elements of the model using the respective functions in the context menu of the column headers. When you are creating the cube, you might want to create a utility dimension called “Period View” as well – you will probably want to analyze the short-term variances at a later time, for example when you get new data, and then you will need time analysis members (see DeltaMaster clicks! 08/2007 for more information). Once you have completed this step, the data is in a multidimensional format and you can work with the full functionality of DeltaMaster.
Note: You could, of course, use DeltaMaster to access the data in the Excel spreadsheet without first creating a cube. Although skipping this step would save you a bit of time, you would not be able to use calculated members. If you just want to walk through the following examples, however, you won’t need calculated members.
First visual check: Is all the data in the pivot table?
You can use the cube that you have just built to create a new analysis session. For starters, simply display the data in a pivot table for a quick visual check. As you can see, it contains all 140 data values.
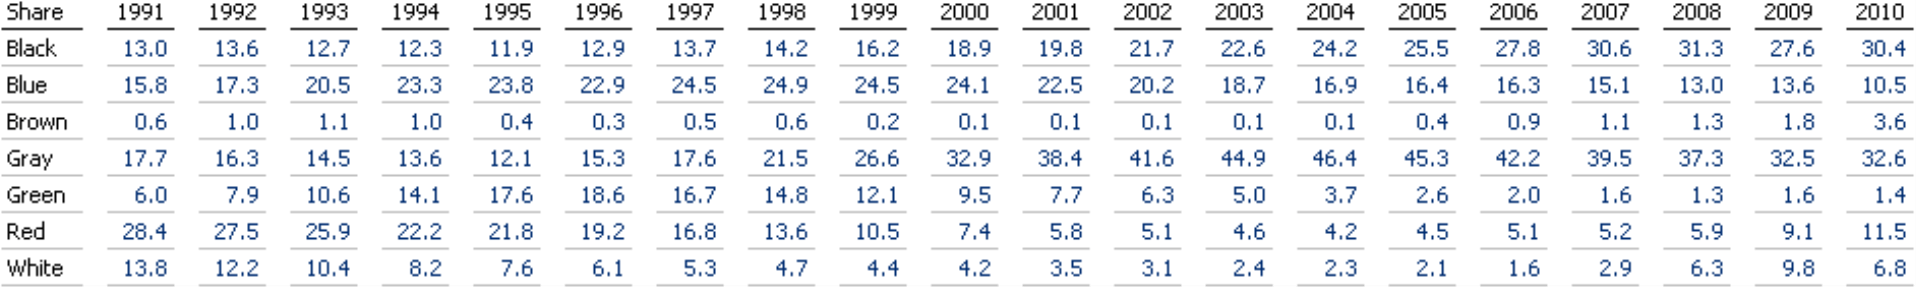
Currently, you cannot detect any developments, size differences, intervals, ratios, or patterns in the data. In order to make comparisons, you will need to delve deeper.
Graphical Tables
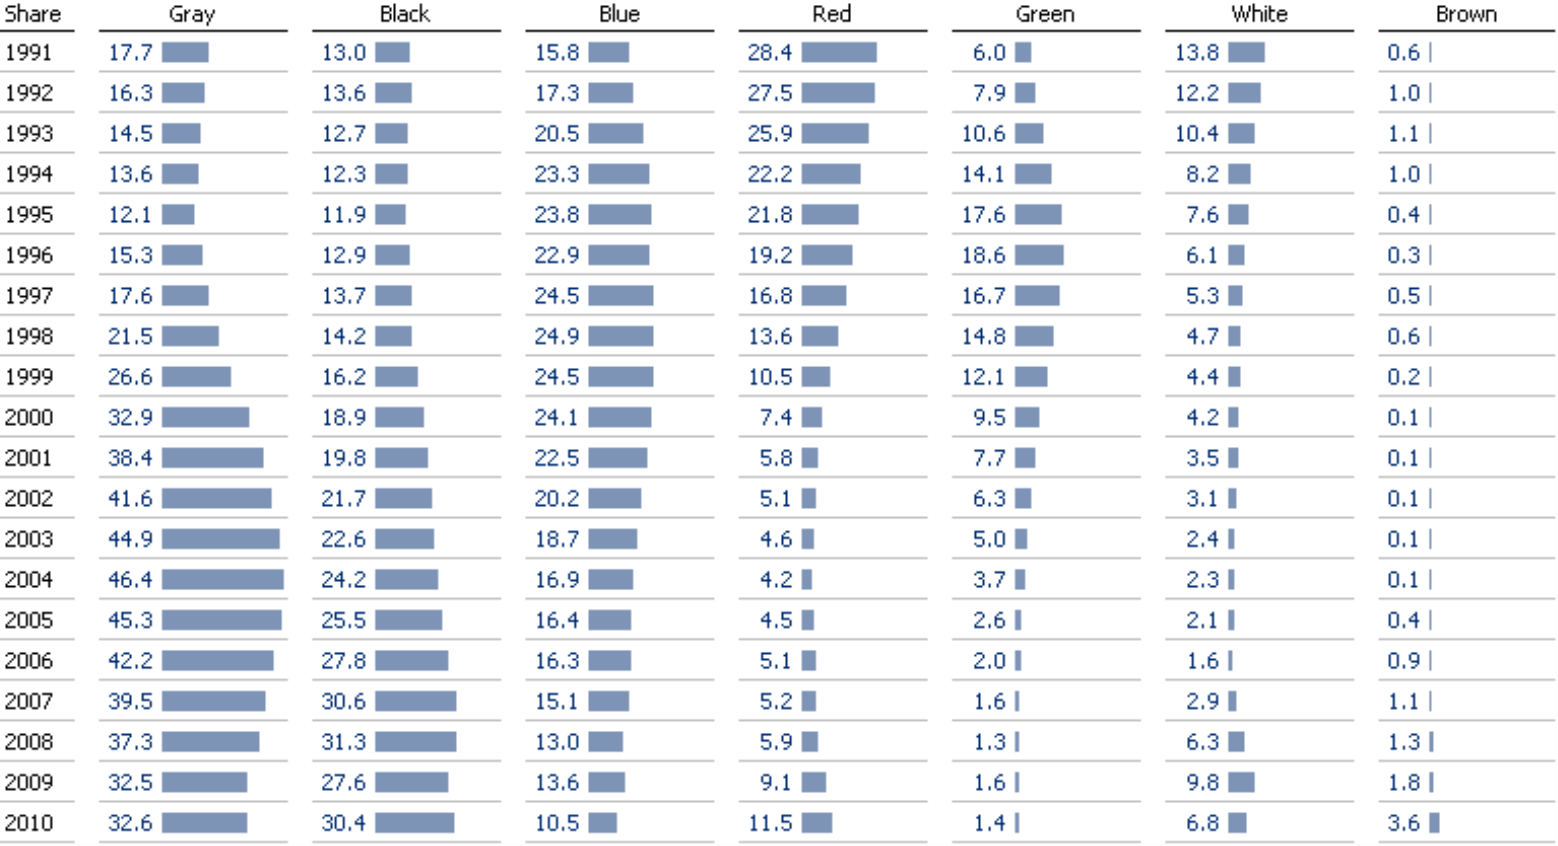
In the context menu of the data cells, you can now display this information in Bars. You can also Transpose the axes in the Change menu to display the years in the rows and the colors in the columns. You can clearly identify the pattern for each color. In addition, you can see every single value. The years, however, run from top to bottom instead of from left to right like they should. You could use columns instead, but then the table wouldn’t be as compact. Try it out and see for yourself.
Pivot charts
With a single mouse click, you can transform the pivot table into a Chart (View menu in the Report, Analysis, or Cockpit windows). You can switch between table and chart views on all user levels from Reader to Miner. This way, you can obtain the exact values from the table even when the report was saved as a chart and the values aren’t necessarily visible there. In order to edit the chart, you need to work in Pivotizer, Analyzer, or Miner modes.
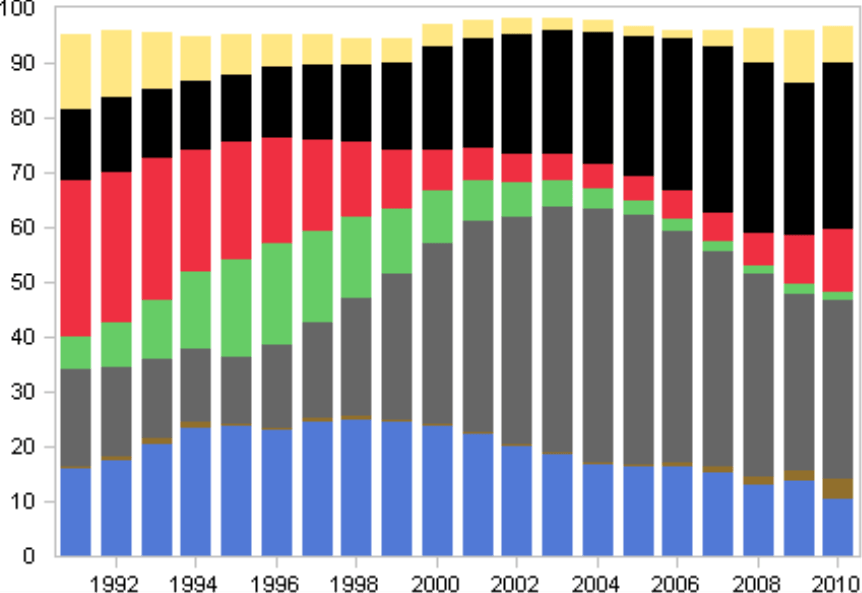
The German Federal Motor Transport Authority occasionally depicts the data in its press releases as a stacked chart. If you reconstruct this chart in DeltaMaster, you are basically turning the spaghetti from the newspaper into lasagna. You cannot compare the individual segments this way accurately because they all start at different heights. You also need to be careful because how you interpret a development depends on where it is in the stack. As Bella already showed in her blog, the same series can sometimes look like it is rising or falling. It all depends on which other series you stack it (www.bella-consults.com/stacks-top-down-and-bottom-up).
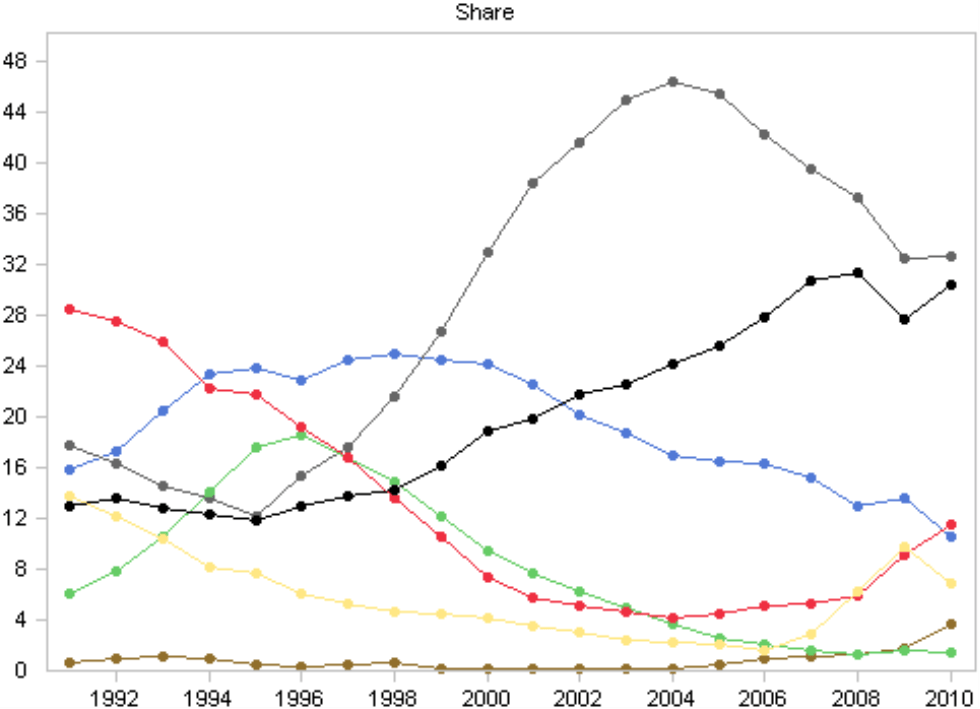
If you change the chart type and create a line chart, it also resembles a pile of spaghetti – just like the original in the newspaper. There are just too many lines for our eyes to follow. The fact that the lines intersect so many times makes the situation even more complicated. At least the interactive feature in DeltaMaster can help you make more sense out of the data on screen. If you mouse over a line, for example, the other lines will become very faint and the selected line will be highlighted. Instead of seeing all of the lines, you virtually see just one – a concept that you will hear more about later. The Point labels are missing here but you could display them using the context menu. Although this would turn the spaghetti into alphabet soup, you should try it nevertheless: Make the chart larger. Everything becomes legible again and more suitable for closer examination. You’ll notice that the scale can only display the most popular colors in a convincing manner. Pivot charts also offer scaling options but the Time series analysis module is predestined for this type of data.
Time series analysis
In the Time series analysis module in Miner mode, you can create a chart similar to the one shown above. (You can also create time series analyses in Analyzer, but only for a single series.) Unlike pivot charts, the Time series analysis primarily focuses on functions that you need to examine the data in a time series from a business standpoint – and not on the chart itself.
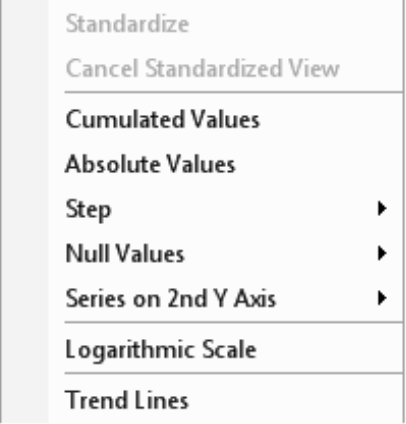
For example, via the context menu you can display Trend lines. If the conditions at a given point in time have changed so drastically that you can no longer compare “before” with “after”, you can in turn split the trend lines up. You can display Cumulated values even if the analysis model doesn’t contain a special dimension. If you select Absolute values, DeltaMaster will invert any negative algebraic signs, which makes it easier to compare positive and negative value series. The Step option is helpful, for example, when you have data at a daily level but the weekday is not a criterion in the data model. Choosing a Step of 7 would display just one day (e.g. Mondays) side by side. These and other functions are only available in the Time series analysis module and are not to be confused with chart options offered in pivot charts.
For the purpose of reconstructing the newspaper chart, the Properties (context menu or I want to menu) are useful. Here, you can define that DeltaMaster should Show [the] absolute and/or relative difference between [the] start and end value as well as between [the] minimum and maximum.
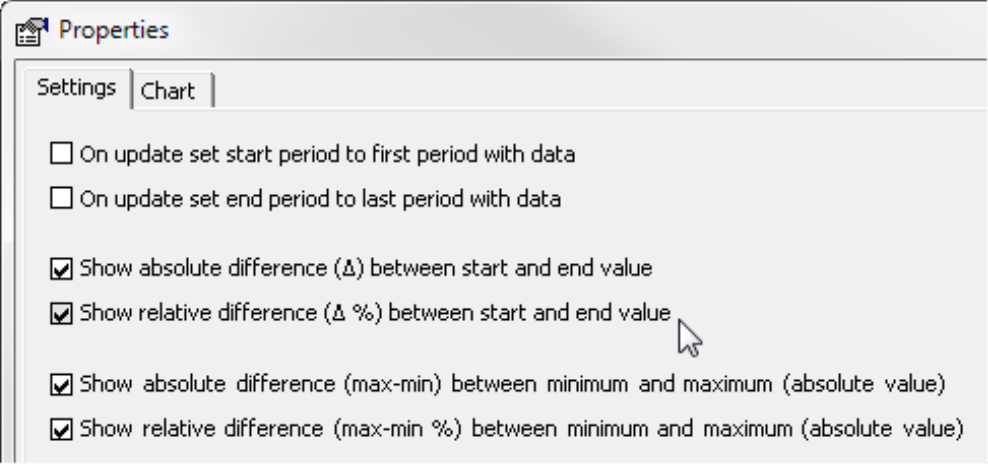
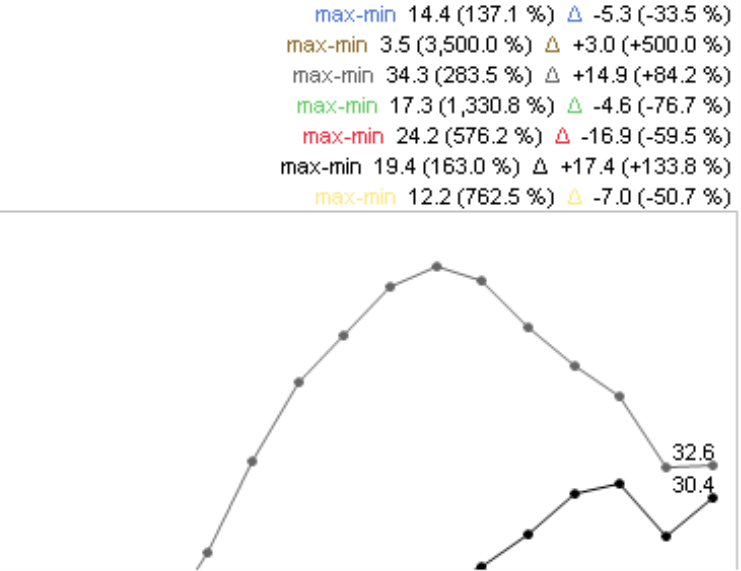
DeltaMaster displays this information above the chart. This information provides valuable clues about the range of values. This range is in turn an important indicator as to whether the scale represents a risk, which is the case in the example on your right. The market share of brown cars, for example, has jumped 500% between 1991 and 2010! That is by far the largest increase among all colors. You would never know that, however, merely by looking at the chart. Since the total number of new registrations for brown cars is on a low level, even these gigantic percentage changes are not visible. Time series with small values are literally “flattened” by those featuring large values. This typically happens when you try to visualize time series of different orders of magnitude in a single chart.
The Logarithmic scale (context menu) helps solve the problem by making relative differences comparable. In this case, the same difference in height stands for the same percentage change of the values. To learn more about logarithmic scales and their advantages, please read DeltaMaster clicks! 07/2010. Even with a logarithmic scale, however, the chart is still hard to read because it contains so many lines.
Small Multiples
So let’s get rid of the spaghetti for good. In Miner Expert mode, there is a special menu command for that: If the analysis contains more than one series, DeltaMaster will display the Convert to Small Multiples option (context menu or I want to menu).
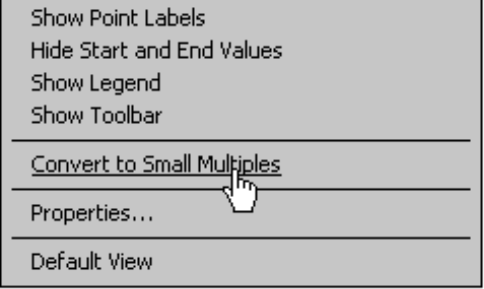
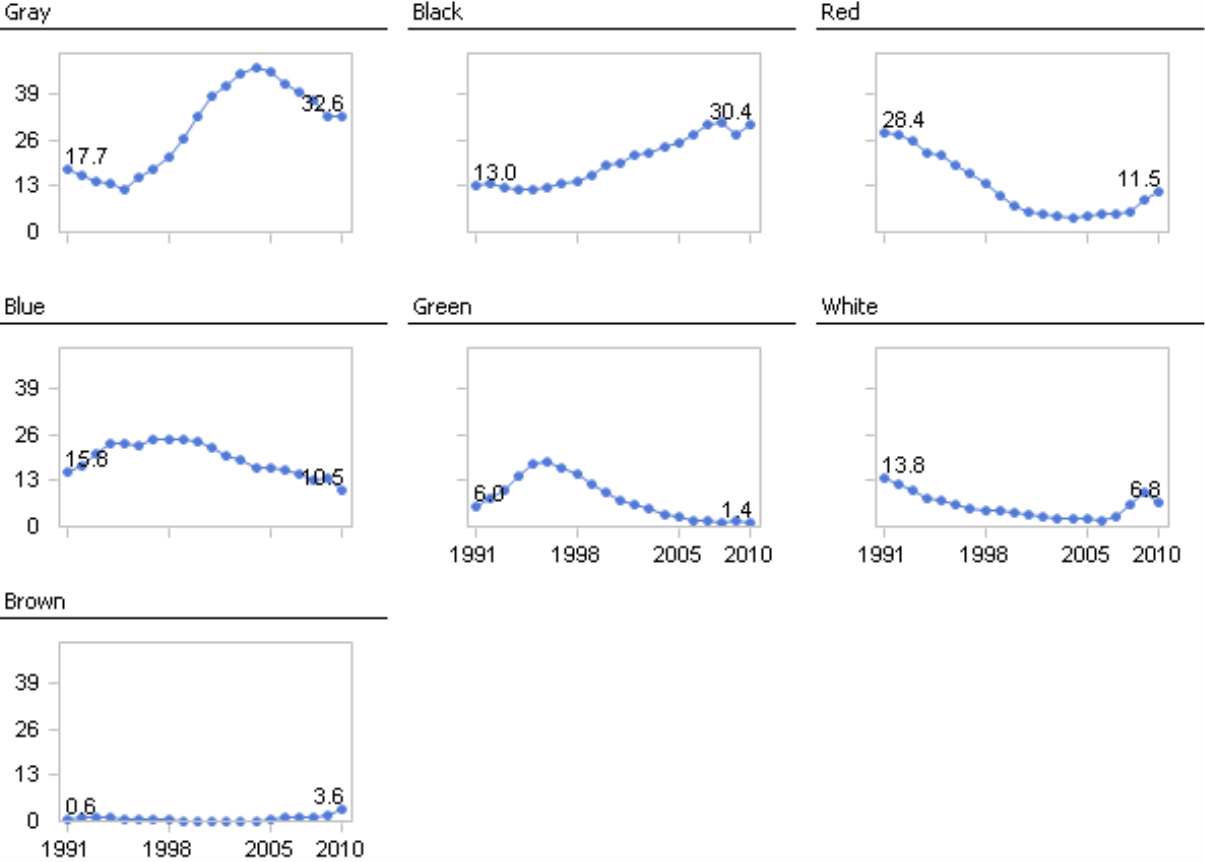
In the Small Multiples module, DeltaMaster creates a small, separate time series chart for each color and combines them into a single report. The report on your right, for example, uses a global scale in which you can see the individual developments clearly.
However, the scale here still hides the strong growth in market share for brown cars.
To change that, create the Small multiples from a logarithmically scaled Time series analysis. The screenshot on your right again uses a global scale, which means that the same axis divisions apply to all multiples. Since the divisions on the Y-axis are logarithmic, however, you can see the strong fluctuations for brown cars and the relatively stable popularity of blue ones. You can achieve similar results using the Comparable scale option in Small Multiples. This scale uses the same percentage range in all multiples in order to ensure their comparability.
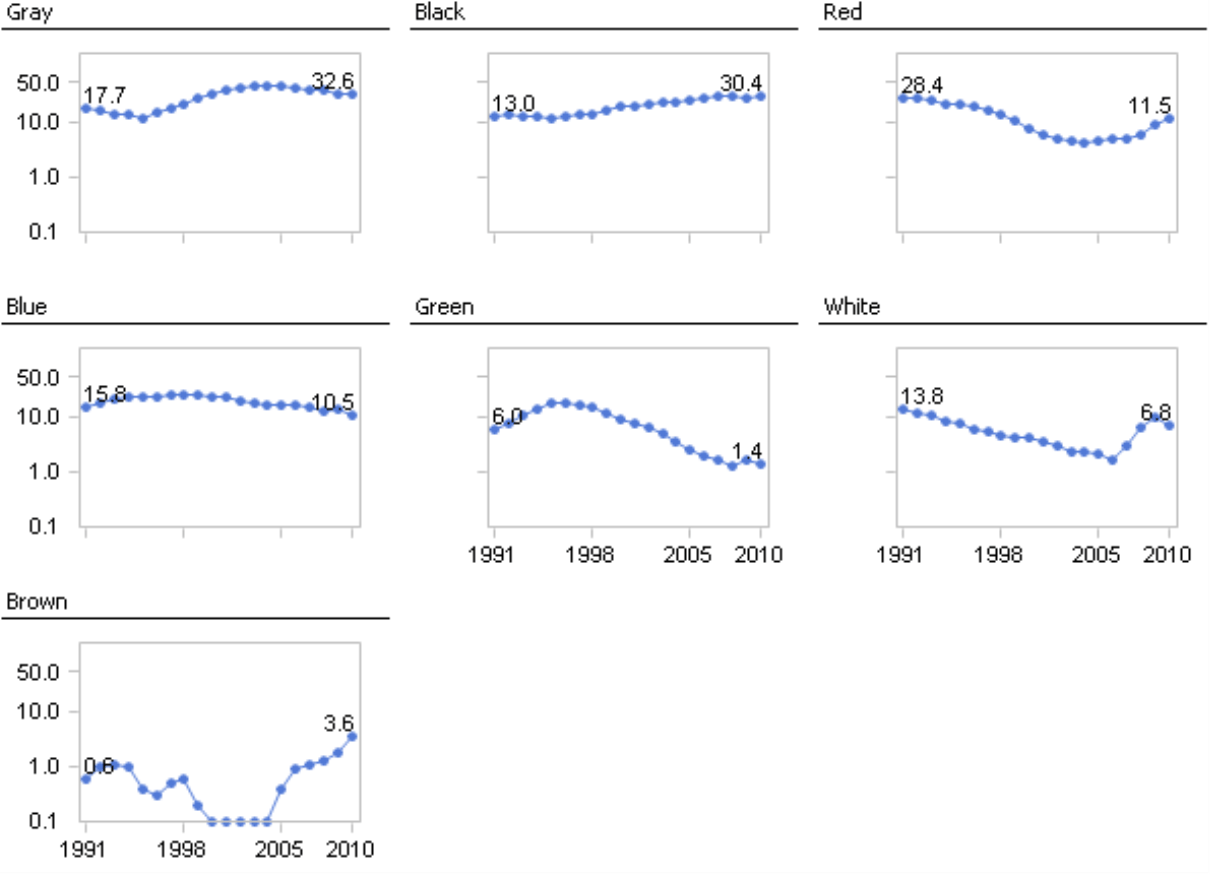
So…does this chart meet your needs? Well, you can clearly see and compare the development patterns – but what about the significance in absolute terms? After all, the strong growth in new registrations of brown cars can be slightly misleading about the fact that the market share for this color is still very low (below 4%).
Sparklines
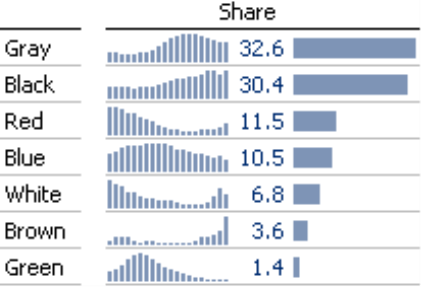
In the next step, let’s therefore separate the comparisons of orders of magnitude and developments over time and return to Graphical Tables. At the beginning of this issue, there was a visualization that showed the market share for each year using bars. Let’s do that again but just for the final year, 2010.
The graphic on your right visualizes these values as bars and shows the development over time in sparklines that are scaled by cell. This way, you can fully utilize the row height in each row and the sparklines have the maximum possible differentiation. The report is very compact and pleasing to the eye. It uses column sparklines with a linear scale due to what we call “perceptive priority” (see DeltaMaster clicks! 12/2011) and you can still see the patterns clearly. For example, the percentage of new registrations for brown cars is low at 3.6%. It is noteworthy, nonetheless, because brown cars were absolutely irrelevant for a long time but have gained popularity over the past few years.
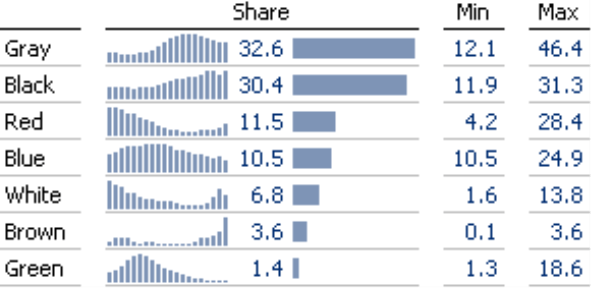
Minimum and maximum values provide additional background information. In the case of green cars, this information is vital. Here, the current market share of 1.4% is so far from the maximum value that the purely visual interpretation reaches its limits. We added the minimum and maximum values as user-defined measures in DeltaMaster.
Conclusion
As you can see again, analyzing time series is a tricky business. When you view time series as a line chart, you get the impression that you can easily see how the values rise, stagnate, or fall. That, however, is not the case. Line charts are commonplace – but it is also common for people to interpret them too hastily. With DeltaMaster, you have all of the tools you need at hand to use line charts when they are appropriate – and to ignore them when they are misleading.
Questions? Comments?
Just contact your Bissantz team for more information.
