CiAgICA8IS0tIExpbmtlZEluIC0tPgogICAgPHNjcmlwdCB0eXBlPSJ0ZXh0L2phdmFzY3JpcHQiPgogICAgICAgIF9saW5rZWRpbl9wYXJ0bmVyX2lkID0gIjEyMzUwNzMiOwogICAgICAgIHdpbmRvdy5fbGlua2VkaW5fZGF0YV9wYXJ0bmVyX2lkcyA9IHdpbmRvdy5fbGlua2VkaW5fZGF0YV9wYXJ0bmVyX2lkcyB8fCBbXTsKICAgICAgICB3aW5kb3cuX2xpbmtlZGluX2RhdGFfcGFydG5lcl9pZHMucHVzaChfbGlua2VkaW5fcGFydG5lcl9pZCk7CiAgICA8L3NjcmlwdD48c2NyaXB0IHR5cGU9InRleHQvamF2YXNjcmlwdCI+CiAgICAgICAgKGZ1bmN0aW9uKCl7dmFyIHMgPSBkb2N1bWVudC5nZXRFbGVtZW50c0J5VGFnTmFtZSgic2NyaXB0IilbMF07CiAgICAgICAgICAgIHZhciBiID0gZG9jdW1lbnQuY3JlYXRlRWxlbWVudCgic2NyaXB0Iik7CiAgICAgICAgICAgIGIudHlwZSA9ICJ0ZXh0L2phdmFzY3JpcHQiO2IuYXN5bmMgPSB0cnVlOwogICAgICAgICAgICBiLnNyYyA9ICJodHRwczovL3NuYXAubGljZG4uY29tL2xpLmxtcy1hbmFseXRpY3MvaW5zaWdodC5taW4uanMiOwogICAgICAgICAgICBzLnBhcmVudE5vZGUuaW5zZXJ0QmVmb3JlKGIsIHMpO30pKCk7CiAgICA8L3NjcmlwdD4KICAgIDxub3NjcmlwdD4KICAgICAgICA8aW1nIGhlaWdodD0iMSIgd2lkdGg9IjEiIHN0eWxlPSJkaXNwbGF5Om5vbmU7IiBhbHQ9IiIgc3JjPSJodHRwczovL3B4LmFkcy5saW5rZWRpbi5jb20vY29sbGVjdC8/cGlkPTEyMzUwNzMmZm10PWdpZiIgLz4KICAgIDwvbm9zY3JpcHQ+CiAgICA8IS0tIEVuZCBMaW5rZWRJbiAtLT4KICAgIA==
Generic filters
Exact matches only
Search in title
Search in excerpt
Search in content

Propellogram

You can’t see some things. Because they are not an object. Or because they are a law. Or because they apply to a lot of things. Then you have to find an example. The example can involve an object. You can draw the object. When you understand everything, you have an infographic. Like this one:

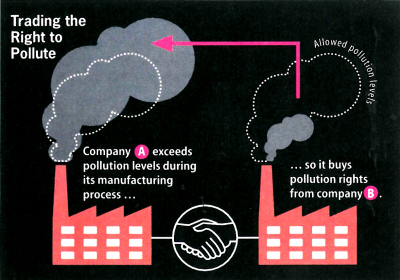
Trading the Right to Pollute

If the object is not an example, it looks like this. Pretty amusing. Customers and suppliers are spheres. Payment and production are propellers. It’s easier to understand without a graphic.
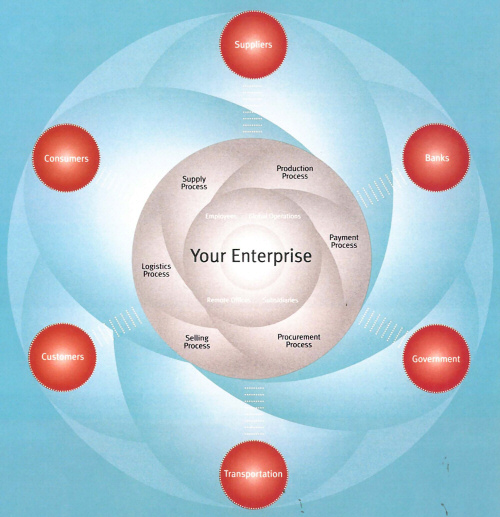
Your enterprise
Your enterprise

Source: both from Kondo, Hiroko, The Best Informational Diagrams, Tokyo 1999, pp. 25 and 37.