Last week, we showed that chopping chart axes is not necessarily a crime. More important is what these fluctuations mean for our intended audience. That, of course, also applies when a reader is supposed to compare several rows of information.
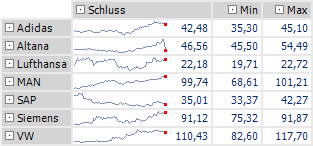
The table displays stock prices based on a scale of their respective highs and lows (sparklines display quotes from 2007-01-02 to 2007-05-03). This helps the reader to compare a stock’s unique volatility based on its price range. Without the minimum and maximum values, however, this chart would be very misleading.

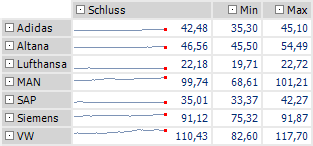
The following charts use a scale between zero and the overall high of all quotes. This chart is free from manipulation, but it doesn’t say much either.

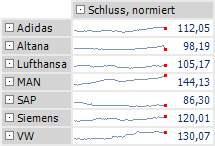
If we standardize the stock performance, however, the reader can truly make intuitive comparisons. Here, the stock prices have been converted to an invested sum of €100 (€100/opening price x current price).

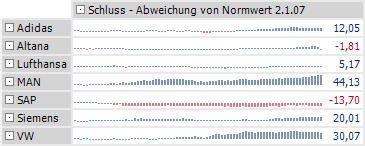
If we use column sparklines, we can clearly see where the portfolio made or lost money.

Wouldn’t it be nice to open the morning paper and enjoy this type of presentation for all DAX stocks?

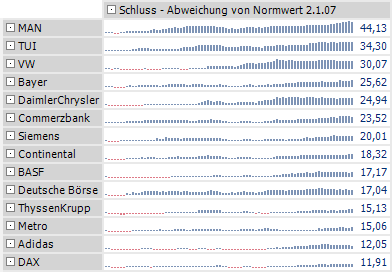
Top performers vs. DAX (since January 2007)

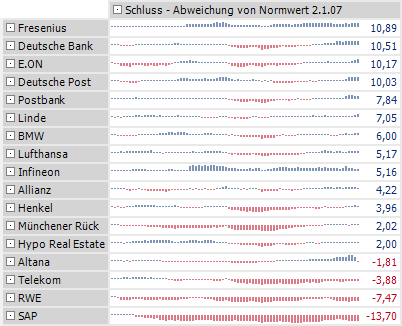
Low performers vs. DAX (since January 2007)
"
["post_title"]=>
string(10) "Leistungen"
["post_excerpt"]=>
string(121) "Unsere Leistungen im Überblick: Software und Consulting-Services von der Datenintegration bis zur fertigen BI-Anwendung."
["post_status"]=>
string(7) "publish"
["comment_status"]=>
string(6) "closed"
["ping_status"]=>
string(6) "closed"
["post_password"]=>
string(0) ""
["post_name"]=>
string(10) "leistungen"
["to_ping"]=>
string(0) ""
["pinged"]=>
string(0) ""
["post_modified"]=>
string(19) "2024-07-25 17:36:00"
["post_modified_gmt"]=>
string(19) "2024-07-25 15:36:00"
["post_content_filtered"]=>
string(0) ""
["post_parent"]=>
int(0)
["guid"]=>
string(39) "https://www.bissantz.de/?page_id=107838"
["menu_order"]=>
int(0)
["post_type"]=>
string(4) "page"
["post_mime_type"]=>
string(0) ""
["comment_count"]=>
string(1) "0"
["filter"]=>
string(3) "raw"
}
Dr. Ulrike NeubauerzwissTEX
„Ganze zwei Tage hat Bissantz für den Aufbau des initialen Datenmodells benötigt.“
Andreas WüstAlmatec
„Abweichungen lassen sich sofort erkennen und ergründen – ad hoc und übergreifend aus verschiedenen Datenquellen.“
Matthias KrebsVoith
Johanna GärtnerWENCO
Carlo BearthWürth International
Thomas SchenkirschAebi Schmidt
Carsten DeeckeDierkes Partner
[dynamic_columns id='134501' title='Zusätzliche System Navigation']
Ludwig StüweLinxens
Melanie RosenbergerScherdel
Patrick TemeschinkoVoith