Stacked, pie and area charts are very common, yet very useless in management reports, presentations and mass media alike. Bars can add meaning…but only if they show variances instead of raw data.
We’ve already made our case against stacked charts and have offered an alternative. Unstacking the data is the first important step in stopping the scam.
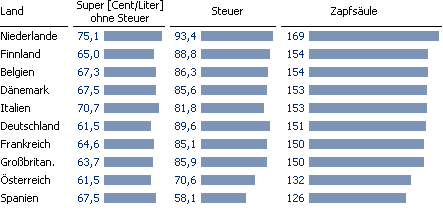
Much better: An unstacked chart
Although the chart above is better, we’re still not satisfied. Why? For starters, we could improve the comparison per country with reference bars. The resulting comparison of price, taxes and total costs across the countries, however, still wouldn’t be optimal.
We make comparisons because our eyes examine the differences in the bars’ lengths. My first presentation, however, devotes the smallest number of pixels to these differences. I used a much larger percentage of pixels to display a minimum that is always the same. In other words, I repeated the same 97 pixels for the value of 126 in the ‘Gas pump’ column in all ten rows. Nevertheless, when a chart uses more pixels to display differences, we can understand its meaning much more easily.
Naïve contemporaries and the developers of Excel may tempt us to believe that we could simply cut off the axes to stress the differences. But we can’t!
What we should – and must – do is decide what we really want to be showing. In the case of comparisons, however, that is rarely the raw data value that the statistic yields. What we really want to show is if and how the data varies from what is average, ordinary, typical, expected, etc.
The corresponding reference would be the past, a minimum, a maximum or an average. In that case, we would be on the right track if we first calculated the variance to the average and then continued our analysis from that point on:
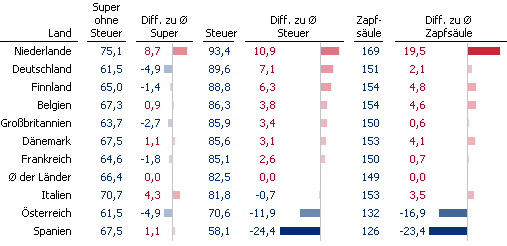
I think that this is a good solution to present the data above. We have learned, therefore, that simply showing raw data does not count as analysis. Comparing means showing variances.
