When Bella starts whining about data visualization, she counts on every last pixel. Yet at the same time, she uses deliberate omission like a form of art. If we reach a point where excluding graphical elements means destroying information, however, it is time to stop.
When we add statistics to our visualizations, we ultimately ask ourselves similar questions. We recently witnessed that on hand from margarine sales in supermarkets. Omitting raw data can hinder the realization process considerably. The marginal utility of additional statistical measures, however, is minimal.
Let’s take another look at our margarine example. What conclusions can we make?
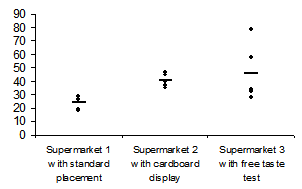
- I only have revenue figures for five days in three supermarkets. Many other factors that I cannot control and may not even acknowledge are affecting sales. Whatever conclusions I make from this information will not be reliable.
- I can characterize the daily revenues per supermarket based on the means. (Alternatively, I can use the median which isn’t influenced by outliers as much.)
- The means are different. Aha.
- If there were a huge difference, I would be a bit skeptical. Why should one marketing campaign have such an immediate effect? What are the chances that I have just discovered THE secret to selling margarine?
- The free taste test witnessed the largest statistical spread. Ahaaa! Perhaps different people worked at the booth and did their job better or worse than the others. I will call the store managers to find out who worked at which stand on which days.
- The large statistical spread around the mean for the taste test signalizes that the expected results will seem more unreliable.
- The results are very interesting. They give me the justification to continue testing. I will consider how personal influences can reduce the effectiveness of a free taste test. For example, I can continue my test with people who didn’t bring extremely good or bad results.
These considerations clearly show what statistical thinking is all about. Measures of descriptive statistics, such as means or medians, help us describe data phenomena concisely. Margins of fluctuation in values are understood as uncertainty – no matter if you transfer them to quantiles or not. Extreme values or outliers always get special attention. Fundamental problems regarding measuring and comparing are always of prime concern. You can avoid methods of inferential statistics without losing valuable insight. After all, the most important conclusions need to come from our part.
