Few things present effects better than a good chart. Effects – not causes. Once again, we will explore the possibilities and limitations of our favorite subject by taking a closer look at its polar opposite: a good text.
The financial crisis is still keeping us on the edge of our seats. Across the world, people continue to debate which lessons we should learn as well as how – or even if – we can ward off the next crisis. The ten members of the U.S. FCIC recently took this task upon themselves. The comission created one report containing the conclusions of the majority and two reports with dissenting views. The dissenters Bill Thomas, Keith Hennessey und Douglas Holtz-Eakin published an abbreviated version of their position in the Wall Street Journal. It impressed me like no other newspaper article has in a long time.
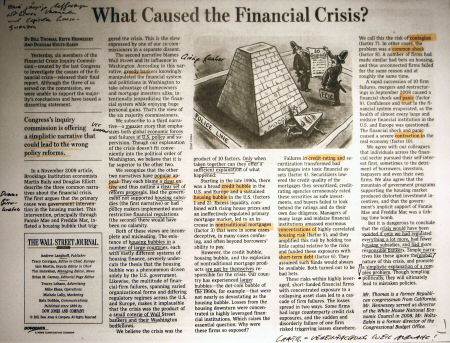
What caused the financial crisis? Greedy bankers? Stupid bureaucrats? It is more complicated than that. The highlighted sections above show the ten reasons behind the crisis. Source: Wall Street Journal Europe, 2011-01-28, page 13.
Please read this article yourself (online or as a printed PDF ). To get started: Thomas, Hennessey and Holtz-Eakin say that neither stupid U.S. bureaucrats nor Wall Street bankers were capable of driving the world close to its demise. Both explanations have prominent supporters, “they each blame a clear entity, and thus outline a clear set of reform proposals.” But the reality is much more complex and only a combination of ten different factors can explain this global crisis. Simplified explanations would only lead to the wrong measures and, therefore, not prevent future crises.
The article filled about half of a page in the Journal and did not require a single data chart. The 29-page official version contains approximately 12,000 words and only includes a single graphic. This relationship between text and graphics really got me thinking.
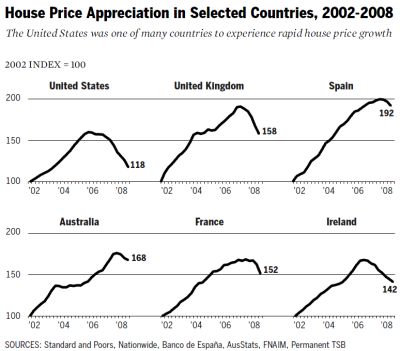
This is the only chart in a 12,000-word report. Is that the right ratio of graphics to text?
Source: Dissenting Statement of Commissioner Keith Hennessey, Commissioner Douglas Holtz-Eakin, and Vice Chairman Bill Thomas. In: FCIC (Ed.), The Financial Crisis Inquiry Report – Final Report of the National Commission on the Causes of the Financial and Economic Crisis in the United States, January 2011, pages 411–440, chart taken from page 415.
Many publications have made attempts to pack the financial crisis into infographics. The blogger Nathan Yau compiled 27 examples. After examining them, I had the impression that the charts with more text were also more plausible. Whereas the options are limited for differentiating graphical elements, you can differentiate texts any way you wish. Nuances are used to express causality in language. Graphics, however, provide no room for leeway. Due to the complexity of the financial crisis, diagrams that primarily avoid text quickly become grotesque because they simplify the world to a point where we can no longer recognize it. If we simplify things too much, they might not make sense any more.

Grotesque diagram: the global economy as slapstick.
Source: Die Seifenblasen-Bonanza, Die Zeit online, 2009-09-01.
The dissenters explain the financial crisis in a very clear, understandable way and use an appropriate ratio between text and graphics for the subject at hand. A diagram can clarify a certain topic concisely – but most times, only one. In general, I would claim: The more complex the topic, the more text it demands and the fewer graphics it stands.
We also crave more text in reporting and analysis. Every diagram necessarily remains a symptogram if it is not embedded in related explanations. If we draw diagrams, we must take a step back and check our arguments as a whole. In most cases, our visualization of an effect only describes the world and does not explain it. Explanations are often more complicated than one might think and require language. A good report contains good charts and good text.
