We already explored 12 rules for making terrible charts. After reading my Sunday paper, I now have to add a postscript: Embellish whatever you want to say with numbers that tell a different story!
“German shoppers feel alone” is the rough translation of a two-column Welt am Sonntag story exploring consumer dissatisfaction. Shoppers in Germany feel that there are too many closed cashiers and check-outs and not enough sales personnel.
The chart that supplements the article does what good data analysis is all about. It delivers context and comparisons to place things in the proper perspective.
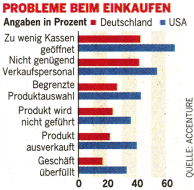
Welt am Sonntag, November 4, 2007, p35
In fact, it does such a good job that it shows the inclined reader that the percentage of unsatisfied shoppers is much higher in the US than it is in Germany. The gaps range between 10 and 25 percent. I would call that a considerable difference.
Two pages back, I read a long article about Rene Obermann’s strategy to reorganize Deutsche Telekom. Under the headline “Telekom Revenues” there was a chart showing the breakdown by landline/broadband and mobile revenues over the past four years. During this time, revenues for mobile phones have exceeded that of traditional landlines and the gap continues to grow. The article, however, focuses on total revenues and stock price development and only briefly alludes to this development. Go figure.
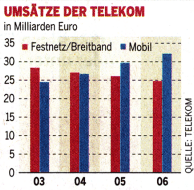
Welt am Sonntag, November 4, 2007, p30
