Intention of a data graph: review values. Register differences. Identify patterns. With this here only reviewing values is possible. You don’t see differences. You don’t see patterns.

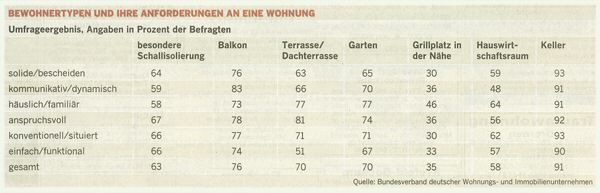
Source: Welt am Sonntag, No. 36, 2008-09-07, p.39
I have to calculate differences myself: all (“gesamt”) minus each value. 42 times.
And transpose all. Because the types belong into columns.
Patterns are best identified with graphs. Therefore: bars.

Reading newspapers can be exhausting.
"
["post_title"]=>
string(10) "Leistungen"
["post_excerpt"]=>
string(121) "Unsere Leistungen im Überblick: Software und Consulting-Services von der Datenintegration bis zur fertigen BI-Anwendung."
["post_status"]=>
string(7) "publish"
["comment_status"]=>
string(6) "closed"
["ping_status"]=>
string(6) "closed"
["post_password"]=>
string(0) ""
["post_name"]=>
string(10) "leistungen"
["to_ping"]=>
string(0) ""
["pinged"]=>
string(0) ""
["post_modified"]=>
string(19) "2024-07-25 17:36:00"
["post_modified_gmt"]=>
string(19) "2024-07-25 15:36:00"
["post_content_filtered"]=>
string(0) ""
["post_parent"]=>
int(0)
["guid"]=>
string(39) "https://www.bissantz.de/?page_id=107838"
["menu_order"]=>
int(0)
["post_type"]=>
string(4) "page"
["post_mime_type"]=>
string(0) ""
["comment_count"]=>
string(1) "0"
["filter"]=>
string(3) "raw"
}
Dr. Ulrike NeubauerzwissTEX
„Ganze zwei Tage hat Bissantz für den Aufbau des initialen Datenmodells benötigt.“
Andreas WüstAlmatec
„Abweichungen lassen sich sofort erkennen und ergründen – ad hoc und übergreifend aus verschiedenen Datenquellen.“
Matthias KrebsVoith
Johanna GärtnerWENCO
Carlo BearthWürth International
Thomas SchenkirschAebi Schmidt
Carsten DeeckeDierkes Partner
[dynamic_columns id='134501' title='Zusätzliche System Navigation']
Ludwig StüweLinxens
Melanie RosenbergerScherdel
Patrick TemeschinkoVoith