Today, we will take a look at a few more ways how we can use the momentum of Big Data to make companies more data-driven. We already know that business professionals should guide IT when it comes to Big Data. Or as Trekkies would say, you need a whole lot of Kirk and not just Spock to prevent Big Data from becoming a galactic flop.
My seventeen-year-old son barely passed the Starship Enterprise test. He had heard of Kirk and Spock, and could probably recognize Spock if he saw him. That was it. For nerds of an older generation, that’s a bit different. At any rate, the Enterprise was even honored at a podium discussion on Big Data. Old Spock from the planet Vulcan became the poster child for the cool, calculated way of understanding automated, computerized analyses. Very good!

According to Germany’s Sunday newspaper “Welt am Sonntag”, even when Big Data doesn’t lead to anything, it can still look good. Does such optimism help or hurt us? We don’t know… yet. Source: “Welt am Sonntag” from 2013-03-03, p. 52.
Captain Kirk, in turn, symbolized the human experience that is necessary to turn analyses into decisions. Great! If that isn’t a metaphor for the unwavering view that it is financial controlling’s job to bring data together, mold it, and clearly visualize what it has to offer. The manager then brings his own experience into play – along with the desire to shape the future and not just foresee it – and makes a decision. Well… the CIO from Amazon saw that differently in the podium discussion. He took the phaser and killed off Captain Kirk. Jeff Bezos was Spock, and no one needed Kirk. Well…
Perhaps the best way to resolve this conflict is to continue with our case studies:
Case 3: How the timidity of data analysis experts and the technical gullibility of users can lead to half-baked models, which become a bottomless pit for investments.
Most times, multiple departments and external experts take part in a data analysis project. There is always someone who is against it and makes it a sporting matter: The expert initially gets data that was just thrown together and is supposed to prove what he can do with it. He can produce some findings but the model is just as askew as the test data. Then it’s time for a presentation: Management is in a rush as usual. IT is reserved with regards to the content. The respective department sends someone who is for the project but cannot raise the budget. The expert is in a squeeze. Actually he needs more and better data, but that means more input, so how should he ask for that? Now the expert either has to convey the message to the executives in their own language or have someone with him who can. That person, in turn, needs to understand the problem of the expert who would probably try to explain it in mathematical terms. Chances are that the expert thinks that the problems with the model can be corrected at a later time, and just nods. The recipe against such a behavior is simple: Managers can understand every data mining model if you just explain it in a reasonable way (more on that in our next post which will talk about the Amazon algorithm) – and they should demand that type of explanation. We once did a project where we had to argue against our own test model during the selection process. The model, which was for a supplier of network technologies, could predict with 80% probability if B2B revenues for the product line would increase or decrease in
comparison to the past year. Due to a lack of data, however, it couldn’t determine the order of the customers. In our opinion, however, that was the real question at hand. After all, it was about deciding who are the best customers to address during limited working hours. We needed additional data on the sales activities. In our case, we got them and the model became productive – but that isn’t self-explanatory. If you are the person who is asking, expect the more technically focused experts to be very soft-spoken. In the case of Big Data, the number of stakeholders will only grow. And in addition to timidity, you will also be dealing with the politics from other contributors as well.
Case 4: If you believe in the “end of theory”, you are really at the beginning of the end.
Chris Anderson, the former editor-in-chief of WIRED magazine, a publication that never lacked in overconfident commentary, declared the “end of theory”. He interprets Big Data just as people interpreted data mining in my days – namely without hypotheses about what it could show. But there is no way to just omit hypotheses and, therefore, theories as well. Each data analysis method can only identify one type of pattern. A cluster analysis locates groups, a decision tree identifies if-then relationships, etc. The hypothesis, therefore, is already in the method. But that is something for scientific philosophers. What’s more important is deciding how hypothesis-free you should be. You can drive computing requirements up the roof by suggesting completeness, which is the Big Data version of being theory-free. If a mail-order company wants to learn which characteristics of products and customers suggest a higher rate of returned items, you don’t need a theory to do that – you simply calculate every possible combination of variables. In financial controlling, however, we try to avoid this carefree way of thinking. Controllers don’t have supercomputers. That’s why all of our data mining methods come with a calculating-time stop button and allow you to omit irrelevant variables from the analysis. At a conference, the German mail-order company Otto reported about its returns analysis and confirmed that they explicitly start with hypotheses (i.e. with a theory) but just a few of them. And it really can’t be more than just a few when you think about the possible actions. Although returns may be frustrating, would it be a successful mail-order strategy to turn customers away just because the computer has calculated an above-average probability for returns? Certainly not. A better option would be to look for rules that the customer understands. If you attempt to buy the same shirt in five different sizes at Otto’s online shop, a pop-up window will try to appeal to your environmental conscience.
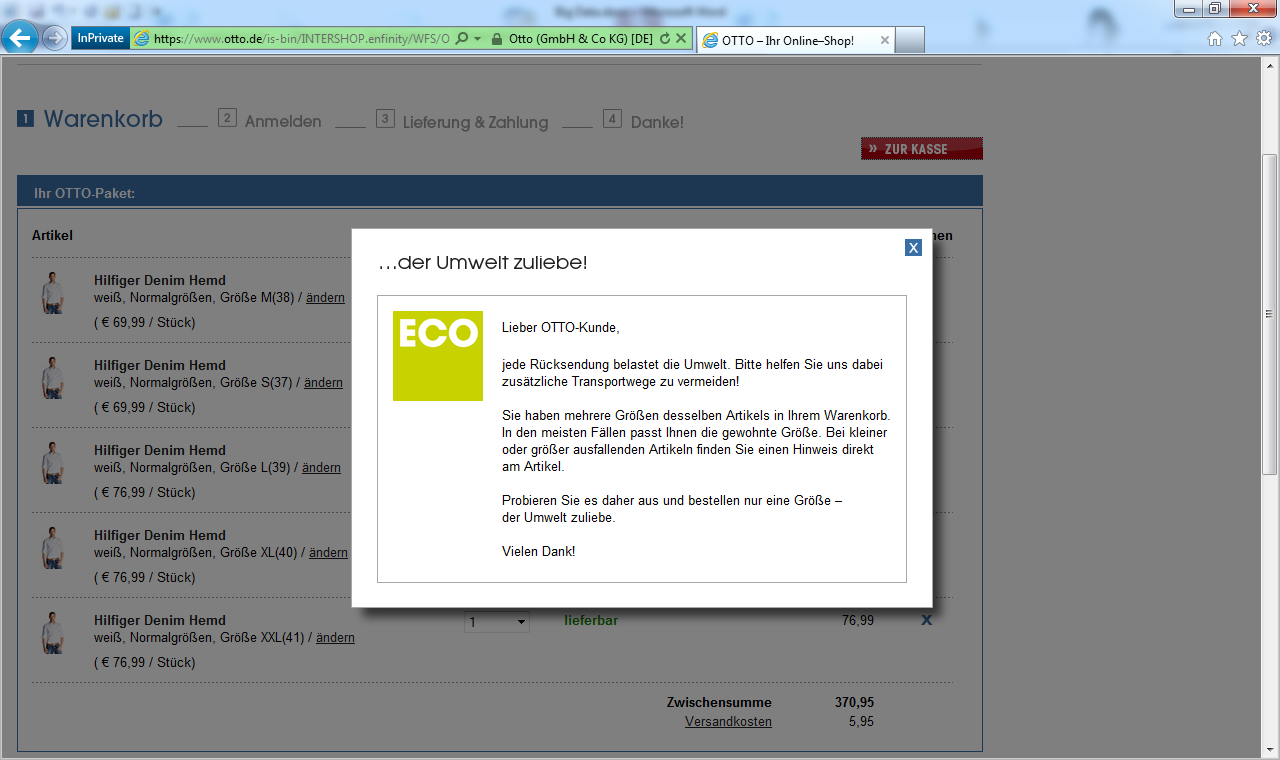
This pop-up window appeals to the user’s environmental consciousness. Source: otto.de.
Click to enlarge.
Case 5: You can earn more money on Facebook with actions than analysis.
I am a fan of strong links between structured and non-structured data. In the Big Data debate, Facebook is almost synonymous for unstructured data – and that’s not a bad thing. What is striking, however, is that people rarely think about systematic problems with that type of data pool. The quality of data analysis has a lot to do with being representative, which doesn’t exist per se in social networks. Even if 1,000 of your customers criticize your products overtly on Facebook, it says little about what your other 99,000 think. A targeted survey of even one hundred somewhat representatively selected customers would provide a more accurate version of the truth. In addition, many companies are buying and spreading opinions on a grand scale. Whatever happens on Facebook and elsewhere is not anymore an innocent snapshot of social phenomena – but rather just one scene in a fierce battle for these phenomena.
