I’m not a fan of traffic lights. That’s no secret. Setting parameters is complicated and time-consuming. The colors rarely make sense. Plus, it’s difficult to set boundaries. For example, if a 5% variance is fine, what’s wrong with 5.1%?
Personally, I prefer data-driven methods such as the gross margin flow analysis that don’t require any parameterization at all. So much, in fact, that we devoted an entire seminar to this topic last year in cooperation with Professor Jörg Link, the mastermind behind it. Perhaps most interesting was a story relayed to us by a fellow advocate of this exceptional method of analysis.
Sales Region II gave too many discounts in November. This led to a 60% budget variance which, obviously, lies outside the normal window of tolerance. The sales manager, Gerd Holmeyer, defended himself vehemently:
“November was a disaster. Marketing raised the prices and we had to respond with higher discounts. Otherwise, we wouldn’t have sold anything!“
The controller listened quietly and went straight to work to appreciate the ceteris paribus analysis, which is delivered by the gross margin flow analysis. Its components show an “as if” gross margin variance. If volume had changed while all other factors remained constant, the margin variance would have totaled – € 366,742. If discounts had changed while all other factors stayed stable, the change in discounts alone would have accounted for a margin variance of – €334,652.
Gross margin flow breaks down a margin variance by its components to deliver important clues about the underlying causes.
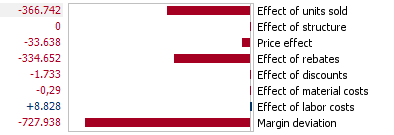
Variance in price is our most important clue. Normally, there is a correlation between price and volume. In most cases, if the price rises, the volume will fall. This, remember, was also Holmeyer’s argument. The surprise, however, is that prices really didn’t rise. In fact, they dropped (slightly) because the price influence was negative. Sales Region II, therefore, gave larger discounts despite the falling quantities.
Upon hearing these numbers, Holmeyer responded with an attack on Sales Region I.
“Sales Region I didn’t meet its revenue targets either. The price increase really hurt profitability there.”
Oh really? Tune back next week to see if this accusation holds true.
