What I learned behind the wheel: When designing management reports there is a lot we have to learn from race car drivers. Part 1: From lap times to Neuroscience to the sudden death of diagrams.
Lesson one – Stucki’s eyes led me the way
The eye movements of world-famous race car driver Hans-Joachim Stuck taught me the first lesson: Together we went to the “Ring”, the legendary race track in Germany. Stucki put eyetracking glasses on his nose and we gathered 20.000 pictures of what he is focusing on while driving his superfast race car. Analyzing this big data set we found out: Movement and contrast direct the eye inevitably – even when it does not help to decide what to do next. Pros like Stucki however learn to strictly keep their eyes on only what is relevant, despite all distractions. There is a racing line for the car with more or less obvious points where to brake, corner, accelerate. And there is a corresponding gaze line with points to look at, in order to derive the racing line. See our documentary for more.
Lesson two – Gerhard defined the costs of thinking for me
From Germany’s most renowned neuroscientist Gerhard Roth I learned: Our conscious mind is terribly limited. It works only sequentially and holds merely four slots. I concluded: Understanding even the simplest table will force the brain to load and reload these slots hundreds of times. A bad sequence will be strenuous and ask for processing capacity that exceeds the time given between phone calls, meetings, and text messages. So, I asked myself, what is the racing line for human number processing, what is the corresponding gaze line for reports?
Lesson three – Diagrams are a detour
The Scottish scholar William Playfair invented most of the diagrams which are in use today: bar charts, line charts, pie charts. This was 200 years ago. We live in times that put pictures over words and tables. To guide the eye many reports rely on William’s picture-like diagrams. It is time to think new: A simple sketch of a cat provokes a real cat in the right side of our brain. A bar or a line remains geometry that has to be decoded. To understand numbers, we need the left side of our brain that is made for abstract and logic thinking. Seeing profit and loss in bars and lines brings the two sides of our brain in conflict.
Lesson four – Back to numbers
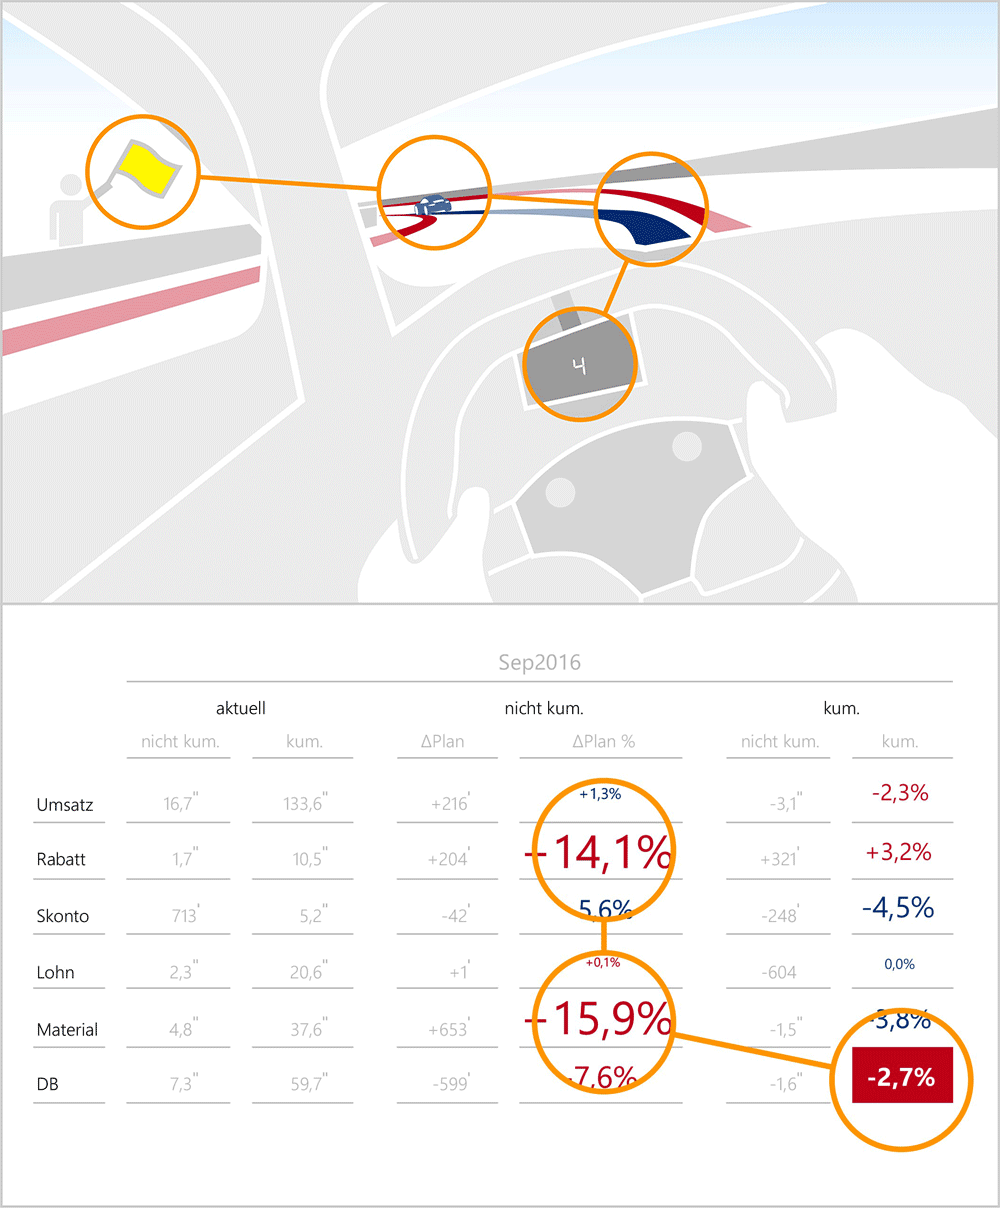
Everything we can count increases in size, space, volume, or weight when there is more of it. Why not numbers? Tag clouds make even letters bigger, when words appear more frequently. Why not numbers? Contrast is leading the eye. Bigger means closer, nearer, more contrast. Graphics size geometry to add contrast to a number. Why not scaling the number instead? This is what I suggest for numbers to guide the eye and leave its interpretation to the left side of the brain where they have to be processed anyway.
