Another way we can measure the quality of our reports is by counting the values per page. So how many data values can a page handle? We say: the more, the merrier. And that’s no paradox. It’s all just a matter of design.
Which companies are facing the risk of a non-friendly takeover due to a drop in their market capitalization? I recently occupied myself with this very question. I had a copy of the FAZ and examined their stock section in detail. As always, I was thrilled that such a high information density is possible on paper.
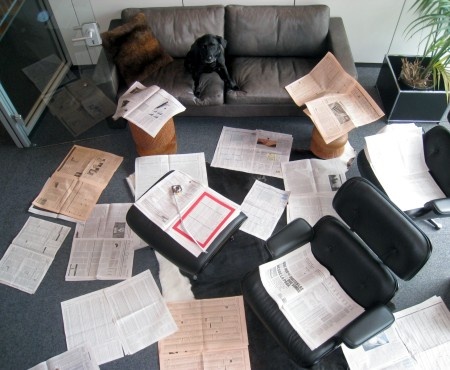
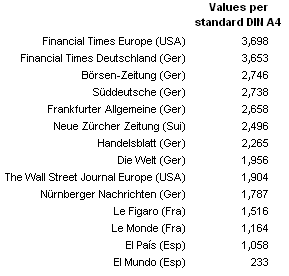
Bella counts the information density on paper. The stock sections of various daily newspapers have approximately 200 – 4,000 values or information units per A4 page.
At a single glance, I could compare the market capitalization (share value x number of shares) of different companies, market segments and countries. Since I accept the fact that I need a pair of glasses and not a larger font size in order to maintain my reading aptitude, I found it much less strenuous than if I had run the query on an online financial portal.
In fact, I only came up with the idea to compare the market capitalization by country while I was reading – simply because it was possible. This same idea applies to management reporting. Good report designs are open – not closed. They go beyond fixed questions to answer new ones which spontaneously pop up in the reader’s mind. (Of course, I would have liked to view the historical data as well. Oh well…someday they’ll surely print sparklines in newspapers.)
Wait…is that supposed to mean that more numbers are better because the number of potential answers increases as well? Exactly. And that brings us back to the paradox. All people who deal with modern reporting desperately try to avoid burying their readers with information. Nevertheless, those same readers want reports that say: What’s the status now? What was it before? Where are we headed? Once we see the collection of columns for the current year, previous year, budget, variance, cumulation and forecast alongside all the rows for products, organizational units and regions, we start to rub our eyes. We see many, many numbers on a page – all of which are relevant and indispensible. If we then create timelines for our data with the help of sparklines (like we’re supposed to) and measure the resulting data density, we realize that we can easily compete with the proportions that Bella counted in the stock sections of daily papers.
Too much data or a sign for good management reports? If the design is good, the more the merrier! (All issues from July 7th 2009)
It’s fascinating because the design reminds me of list reports back in the days of mainframe computers. Up until now, they weren’t exactly what you’d call ideal for modern decision support. How wrong. We need to measure ourselves against the green- and white-striped printouts on continuous paper. The lists were not filtered. They contained all numbers that were available. Decision-makers decided for themselves which filters they would use and which data they should ignore. Back then, reports were like a reference book.
Even today large corporations expect that managing directors of smaller subsidiaries know every proposal, every order, every obligation and every employee contract so that they can recognize a potential problem even before the monthly reports are published. They need unfiltered, non-summarized data.
For me, the goal of report design is not to reduce the volume of data. It is to use design elements to make large amounts of data legible in small spaces. These techniques already exist thanks to graphical tables and sparklines.
For our search for quality measures, we can come to the following conclusion. We should be able to assess the quality of a report by counting the number of values in graphical tables. Long lives the “data graveyard 2.0”.
