The color concept in DeltaMaster is one of a kind in the industry – and the result of long, careful deliberation. It uses the luxury of business professionals to explain everything sensibly and send strong signals – all with just two colors. Now we know that blue and red combined with the system colors orange and gray have an inherent, magical effect – one that is not yet completely deciphered.
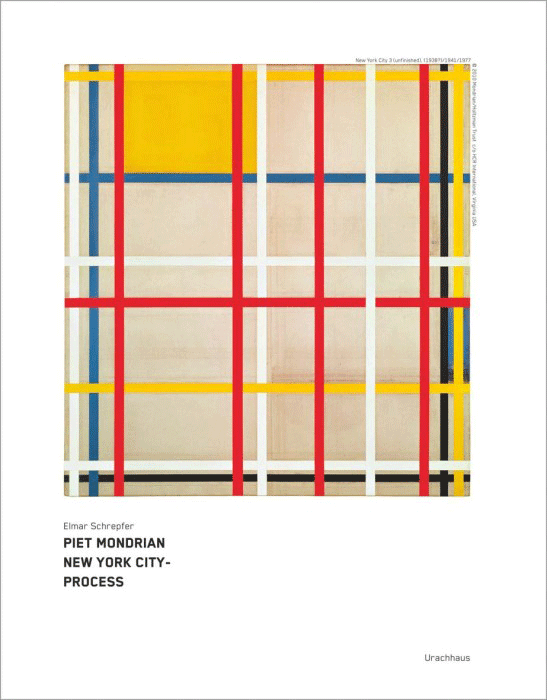
A few years back, Elmar Schrepfer informed us about his book, which was just being printed at the time. Schrepfer was able to decipher Piet Mondrian’s masterpiece “New York City”. At this time, Schrepfer had been using our Business Intelligence software DeltaMaster for several years. The automated navigation, which guided him to detect the causes of profit changes in his day-to-day work, inspired him to deconstruct “New York City”. This picture was long viewed as impenetrable – just as a complex operating profit hierarchy may appear to be.
We were sponsors, but could only guess why. Now we know that the color concept in DeltaMaster is Mondrian.
Schrepfer took a picture that showed nothing other than a large yellow rectangle and a small blue rectangle and placed it on an easel. He then pulled one colorful strip after another from behind the easel around the tableau and “New York City” appeared before our very eyes.
We were enthralled by this unique, constructive performance. The book and its detail electrified us even more. Each left page shows the last change in the color process while each right page shows the cumulated effect of all changes.
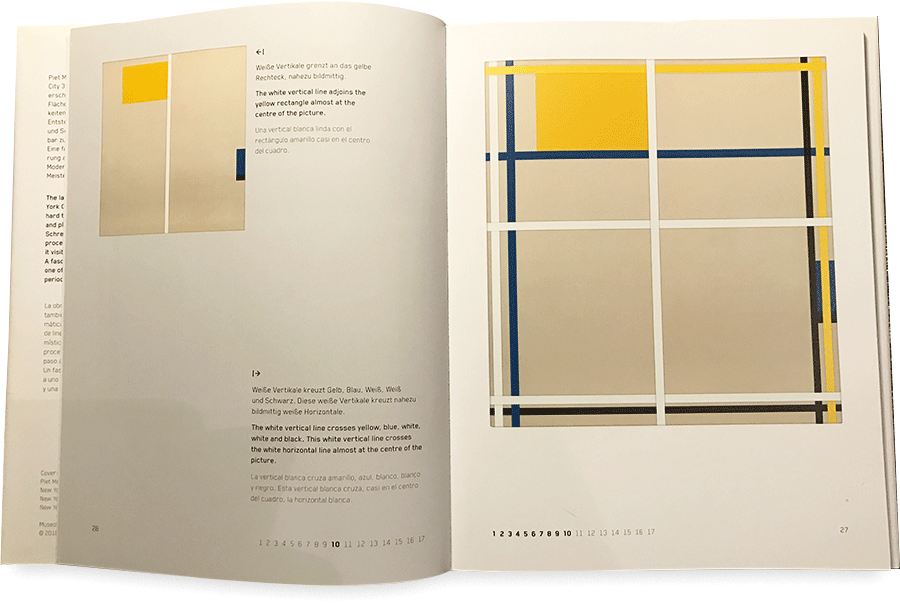 Left, the current variance, right next to it the cumulated variance – the exact same, logical way you would present variance numbers.
We enjoyed being a sponsor and gave free copies of this groundbreaking work to our clients and partners.
Now, let’s fast forward to the present day. Fabian Kragenings (Porsche Design) just sent us a draft for a schematic presentation where we want to illustrate the problem of graphical no-nos. He wasn’t quite satisfied and first only played around with the colors of our software. So I took a look at his draft and my jaw dropped.

The four colors of DeltaMaster: Two for data, two for usability. We selected these colors with perception and usage in mind. That someone can interpret this as art, makes us all the happies.
Although we never made the connection before, the color concept of DeltaMaster is the same as “New York City”. As our users know, we only use red or blue for data (for good reasons). Selections and the provisional state of our edit mode is orange. Everything inactive is gray. Fabian’s creativity in toying around with the squares finally brought the correlation between our concept and the colors used by Mondrian so clear to light.
Simply magical.

Kommentare
Sie müssten eingeloggt sein um Kommentare zu posten..