Although Frankfurt’s banks are wobbling, there is good news to report from ‘Mainhattan’. With its new graphical tables, the renowned FAZ newspaper is ushering in a new era for its stock pages. Why is that good for managers as well? More information density for them and money saved for the FAZ!
Given – they aren’t sparklines. Nevertheless, FAZ has been using small graphical elements in its daily financial section since January 20, 2009. Munich’s Süddeutsche Zeitung has already had some on their stock pages for quite a time now. Still, I personally feel that the Hessians have taken a clear lead over the Bavarians. Despite Bella’s valid criticism, the Süddeutsche is wreaking daily havoc with their graphics because they chop the most interesting (i.e. the largest) variances.
At any rate, FAZ has been using a new design for its stock charts for almost three weeks now. The reason? The newspaper had to cut back an entire page to save costs. Beyond removing a few of its more exotic notations, it also made its stock charts more compact. The first stock page now shows 900 listings. In short, higher information density means lower printing costs for FAZ.
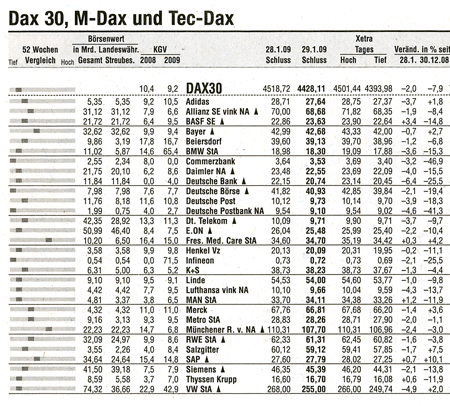
Frankfurter Allgemeine Zeitung (FAZ) from 30.01.2009, Nr. 25, p. 26
The stock section of newspapers has long set the standard for good information density. Sure, we know that there are still many bullheaded people who love their dashboards with multiple traffic lights and little data. Even though they turn a deaf ear, that won’t stop us from screaming that the sports section – not to mention the stock charts – offer a much higher data density. And that is precisely why millions of readers love them!
The FAZ has now added a “bar chart” to the prices of Dax and Stoxx stocks. “It shows where the price is currently located on a bar indicating the 52-week low [left] and high [right].” (translated from FAZ: 20.01.2009, Nr. 16, p. 19). DeltaMaster fans are already familiar with this visualization technique. It’s called a scale and it supplements sparklines.
We can very well imagine that revamping a sacred institution such as the stock section of the FAZ was no easy task. For the record, we congratulate the editors on this great step forward.
Of course, we would have preferred that they had used sparklines as well. Once people see this successful visualization and understand it, they will surely also want to know other things as well. Is the current trend positive or negative? How long ago did the price hit the extreme values? And there are so many more questions…all of which a simple sparkline could answer.
