Information has to be fluctuation-proof – especially when it deals with risk: Oftentimes, people who produce information today are new in the office, new at doing it, or only do it sporadically. And I think it shows. Let us use more norms and standards – at least business ones.
This week in Zurich, Professor Peter Mertens will be speaking about management information systems for regulatory bodies. His presentation ties in with his 2010 article from the German IT journal Informatik Spektrum* in which he examined the causes of the financial crisis from a business informatics viewpoint. In this article, he challenged the representatives of these bodies to break away from two conventionalized ideas: 1.) Report consumers need to have the necessary competence in the field and 2.) Report authors and consumers need a relationship built upon trust.
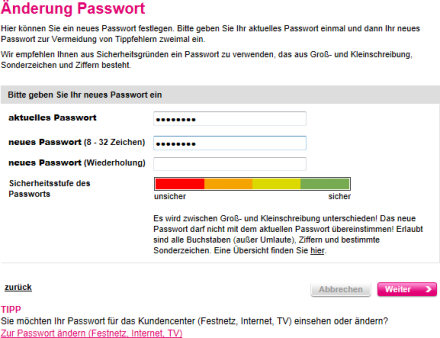
Risk report for password security. It would be idiot-proof if the graphic designer would have designed it like everyone else does – namely by coloring the entire bar green. Source: t-mobile.de.
Why? Each person would then not only be summoned to consolidate the business numbers “mechanically” but also to interpret the results automatically. In addition, automating reporting this way limits deceitful interference. I thought long and hard about this as I “dawdled under palm trees” – a term Professor Mertens, my former doctoral advisor, uses for vacation days. When I was his assistant, they were simply dubbed “idleness” and the calendar on which we entered them was the “vacation pillory”.
At the same time, I pondered about a recent blog post from Bella about usability. On the way to those palm trees and back, she saw plenty of examples of user unfriendliness. One of her examples, however, fits better here because it marks where risk reports start. I wanted to know the “palm tree rates” for my mobile phone contract. To learn more, I registered as a user on Telekom’s Web site. There, I was confronted with a traffic light chart that visualized how secure my desired password would be. I stopped. How could my password be red, orange, yellow, and green all at the same time? Of course, it wasn’t. After a few seconds, I was able to make sense out of it. If the graphic displays all of the levels, the password has passed all of the requirements. Everywhere else where I had ever seen a dialog box like that, the entire bar changed in color. In fact, it is almost the standard. You could argue if that is good or not. Either way, it is easy to understand. So why did Telekom do something differently? Is that the decision of the programmer who created that dialog box?
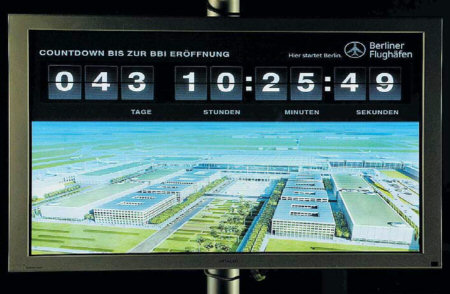
At some point in time, the countdown in the visitor center of the new Berlin-Brandenburg Airport stopped. The German newspaper FAZ said that was because the risk reports did not work. Why? Because the traffic lights didn’t know what red was. Source: FAZ, 2012-05-24, page 3.
I then thought about the latest victims of unsatisfactory risk reporting – the Berlin-Brandenburg Airport and its supervisor Klaus Wowereit, the governing mayor of Berlin. Who built their risk control system? In an article published on 24 May 2012 in the German newspaper FAZ, Kerstin Schwenn described the situation. Here is what she said in English:
“The airport’s traffic light system is almost legendary. The system categorized all completed parts of the project in the colors green, yellow, and red. Red lights, however, were forbidden. Since yellow was the worst-case scenario, the color-blind managers couldn’t easily differentiate between red and green. People who raised critical questions were told to be patient. In the supervisory board meeting on 20 April 2012, the managers promised the board members green lights and blue skies ahead. Optimism became a reality loss within the management team. This is the only explanation for the late cancellation.”
Following Ronald Weckesser and Günther Beckstein, that makes Wowereit the third German politician whose failure as a supervisory board member was brought in connection with risk control systems based on traffic light charts by the press. I was just about to devote this blog post to the fight against alleged unambiguity as I caught a glimpse of a chart in the online edition of the German newspaper Handelsblatt.
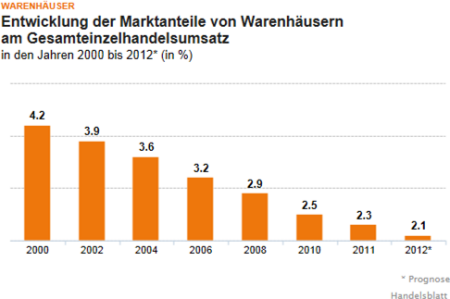
Distorted and compressed: There is more wrong than right in this chart. The years go by at different rates. 4.2 is 25 times larger than 2.1. Source: handelsblatt.com, image taken on 2012-08-02.
After looking at this type of “craftsmanship” in a business newspaper, I didn’t feel like philosophizing any more. Instead I thought even more of the water that Mertens poured into the wine of Business Intelligence. He referred to something that more and more U.S. customers are demanding – something that is “fluctuation-proof”. That means that the same reports and dialog systems are also used by employees who haven’t been in the company for a long time and probably won’t stay in the same position for long either. In other words, they do not have the necessary skills to use those reports and systems.
What do Telekom, Wowereit, and Handelsblatt have to do with Mertens’ demands and the consequences of fluctuation? Each of my three examples visualized risks, and in each of these cases they did so for fluctuant readers – in other words, people who are in a hurry and aren’t necessarily blessed with the necessary skills. In these three cases, however, you cannot see that it is working. We need to add something to Mertens’ demands: We need to break from the idea that the authors of reports need to have the necessary competence in the field. If we can’t rely neither on the author nor the consumer and their relationship isn’t built on trust, we need standards.
We already quoted that the green bar should be the standard for the traffic lights showing a safe password. Gene Zelazny** has long since documented standards for charts at McKinsey. Dona Wong*** has done the same for the Wall Street Journal. Bella has collected her own rules and even summarized them into a book that uses before-and-after examples.
If what the FAZ said is true, the airport supervisory board should have asked themselves: Which risk standards are resistant against the purpose of being optimistic? I think the barrier of deceiving oneself or others would be much higher if the board members only wanted to know: Which stages of the project are how many days above schedule and are they on a critical path? If the planner themselves believe in the whole green, if the supervisory board members prefer colors instead of numbers, isn’t it normal that the optimistic version of red is yellow? Because: only people who are asking for facts will recognize whitewashing. Only people who are being asked for facts have to show one’s true colors.
* Mertens, P., Führungsinformationssysteme für Kontrollorgane – neue Paradigmen für die Managementinformation, Informatik Spektrum 33 (2010) 1, pp. 14–26.
** Zelazny, G, Wie aus Zahlen Bildern werden – der Weg zur visuellen Kommunikation, 5th Edition, Wiesbaden 2002.
*** Wong, D., The Wall Street Journal Guide to Information Graphics – The Dos and Don’ts of Presenting Data, Facts, and Figures, New York/London 2010.
