Automation is the key to efficient reporting. Forget control robots or Artificial Intelligence – all you need is common sense and just a bit of programming.
I have already made my plea for industrial reporting. I have also called for robust types of report formats that can be automatically filled with data without any need for further processing. Personally, the analogy to industrial production inspires me most. The manufacturing industry has reached a level of automation that most controllers could only dream of. In fact, when you compare it to the “efficiency” of most management control tools, it’s downright depressing.
Experienced programmers often laugh out loud when they see how finance professionals torment themselves with manual labor reminiscent of pre-Industrial Revolution conditions. The short animation below illustrates this point through a concentration analysis for product revenues. It is supposed to show which articles are most important and if revenues are well distributed throughout a product line or concentrated on just a fraction of it. The articles are grouped into class A, class B, or class C. Class A contains just a few articles, but they have the biggest share of the overall revenues (Pareto principle or 80-20 rule). The question at hand is whether the “C” articles should be eliminated from the overall offerings.
Manual concentration analysis in Excel. Please click to enlarge.
As this animation shows, you have to collect, sort and then create a sum of the data. Then you need to create percentages and a cumulative sum. Finally, you define thresholds for the classes so that you can draw conclusions such as: “We generate 75% of our revenues from a quarter of our entire product line.” As with many textbook business analyses, the steps for analyzing information are exactly the same. It doesn’t matter if you are analyzing sales reps, customers, regions or articles; you need to follow the same boring steps as always.
I first realized this concept back when I was working as an assistant to Peter Mertens, the pioneer of modern business information systems in Germany. The year was 1993 and Artificial Intelligence was the craze of the days. Following the trend of the times, our research group went beyond trivial macro programming. Our goal was nothing less than a financial control robot. Although that (fortunately!) never came to be, other useful findings have come out of 20+ years of research.
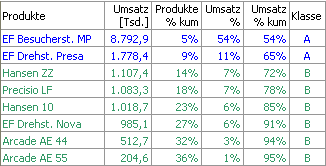
Automated concentration analysis in my beloved DeltaMaster. Please click to enlarge.
One example is automated concentration analysis which has proved its worth over the years. We even applied the basic concept of delegating routine tasks to the computer to very complex methods. In fact, we recently won a prize for our automatic navigation methods.
This also resulted in another automation principle that reciprocally affects our concentration analysis. The loading, sorting and cumulation processes comprise many trivial steps that are anything but rocket science. The classification, however, is a bit trickier, and is a type of decision heuristic. While we were researching the right approach, we came to the humble conclusion that you can mathematically replicate the routine decisions of an experienced user.
The heuristics of classification: How do the marginal amounts vary most?
In the case of concentration analysis, a controller would go through the list of product revenues and place the boundaries between A and B as well as B and C where the revenue of the next article strongly differs from that of the previous one. In terms of graphics, this would equal the bending points in the concentration curve. By adding a few further rules to this simple principle, the computer can classify this just as a person normally would. And since “normally” is not “always”, the user has the final say in the matter and can easily change how the classifications are drawn.
