I have already dampened the enthusiasm for fans of self-service BI, the promise of do-it-yourself analyses on all levels of a company. Now here is more food for thought: Working with KPIs is tricky and requires experience if you want to do it right. Senior-level managers have that experience and shouldn’t give up that power. Here are some tricky thoughts about percentages.
Companies make dreams reality. They can implement innovations, turn around power structures in established markets, and break the dominance of market competitors or even rivaling nations. That requires just as much aggressiveness as creativity – and, of course, money. Whoever has the most has an advantage. The larger the war chest is, the larger the scope for investments. These are all truisms in business – so why am I mentioning them here?

Maybe this is a hair salon of a retail chain with the largest EBIT as a percentage of revenues. So what?
Because I have the impression that many management reports don’t reflect these maxims enough. Although that only becomes apparent upon closer investigation, it makes a huge difference on the effectiveness of reports. Money is an absolute value, yet I see many reports that focus on relative values. If a report directs the readers’ view too much, relative values such as margin as a percentage of revenue are not just included for their information. Instead, you have a situation in which:
a) the report is sorted by percentage values,
b) absolute and percentage values are mixed together, which makes it more difficult for the readers to sort the report mentally or
c) graphic elements steer the readers’ focus to percentage values.
Yes, but don’t we have to first observe, promote, and multiply the products, customers, channels markets, and orders with the highest margin? If we could, yes! But another truism in economics says that high margins quickly create envy and, therefore, competition which, in turn, makes the margin fall. In the real business world, high margins are limited to a few objects, sometimes even for a limited time. At any rate, you cannot just multiple them any way you wish. That translates into high margins for items with low revenues.
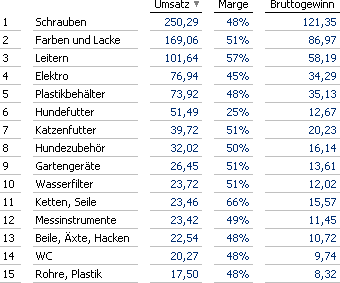
Sales at a home-improvement store: Top 15 product groups sorted by revenues.
Yes, but aren’t there KPIs that you want to minimize or maximize such as sick-leave rates, delivery reliability, defective goods, capacity, or initial assessment rates? Don’t we want to be as healthy, reliable, non-wasteful, and busy as possible – not to mention, be able to immediately solve the problems of our customers and partners? In that case, a 100% or 0% rate should be the target, correct? No! If you only have two employees in a department, the sick-leave rate is already 50% when one person is ill. What do you want to take a look at first – that or the 1,000 missing hours in the production halls because the sick rate has increased from 1.3 % to 1.5 %? No business professional can make a conclusion without a monetary value or, alternatively, a quantity – in other words, an absolute value.
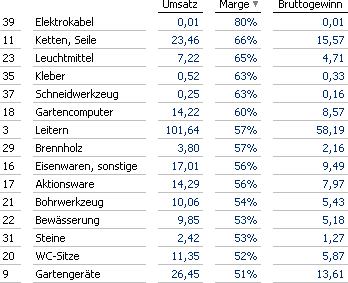
Sales at a home-improvement store: Top 15 product groups sorted by margin. Now the order has switched. Electric cables have jumped from #39 (based on revenues) to #1.
Yes, but isn’t the market percentage an exception? Correct. One of the few things that you can substantially prove in business is that a company’s returns increase along with its market percentage. As a result, maximizing the market percentage is a rational goal, which can be expressed as a percentage value.
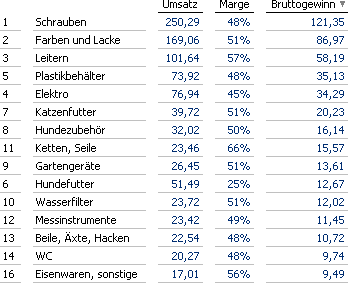
Sales at a home-improvement store: Top 15 product groups sorted by gross profits. A very useful ranking. It directs the reader’s view to the money that will be later needed for other business activities.
Yes, but doesn’t a relative value provide a more objective comparison? When you buy a car, for example, you also compare the manufacturer’s rebates on the list price. Analysts compare the EBITs of different companies. You can use the unemployment rate to compare periods over time. No, objectivity is not the case. You need to be extremely cautious when you are studying them. The longer you look, the more distrustful you become. What good are large rebates for new cars when the resale price sinks as well? A market leader that has tripled its revenues but has the lowest EBIT in the industry is still feared by its competitors. A constant unemployment rate in combination with fewer job terminations and placements suggest that the job market is tightening.
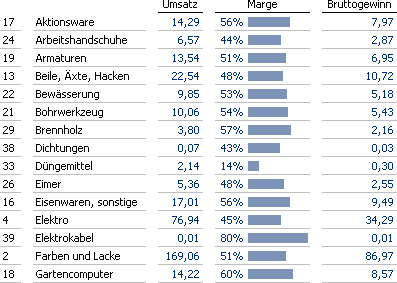
Sales at a home-improvement store: Top 15 in alphabetical order and with bars representing the margin. The focus is now on the products with the strongest margin – regardless of their relevance to revenues. A botch job.
To illustrate this point, we have sorted a few typical revenue and margin values in different ways based on either the order or graphical elements as in the last example. The respective caption provides a brief assessment of the applied ranking. See for yourself: Our limited attention span is inevitably guided by the way the data is sorted.
This guidance, however, shouldn’t distract our attention from what is important. As a result, the right sorting method is a decisive factor in determining a report’s effectiveness. That even applies to simple tables such as the ones in our examples. When you include a few more measures, as is often the case, it becomes even more important to give your readers the visual orientation that they need. Otherwise, a minor distraction can quickly snowball into major mismanagement.
Of course, everything is much more complicated than that. What we have said applies to something that I like to call “intra-relativity”, which is when percent values place two absolute values in relationship to one object. Gross margin percentage is calculated as gross sales divided by revenues. That is the introverted version of relativity. If relativity should support management, we need its extroverted counterpart – in other words, “extra-relativity” – as well. We will talk about it soon.
