Intelligent traffic lights for controlling
Traffic light functions belong to the same category of dubious analogies as the dashboard.
In the world of the car driver, a traffic light provides two clear signals: red means stop, green means go. In business reality, this clarity is painfully lacking, and it is something that even multi-colored reports cannot create. At the traffic light we can only either stop, or drive on. In contrast, a company has countless ways in which it can react to red or green signals.
Paradoxically, the unacceptable simplification of the traffic light paradigm goes hand in hand with criminally complex operation. We have already explained this in detail elsewhere*: in multidimensional deviation situations, the traffic light function multiplies the warning signals unnecessarily through the report hierarchies. What’s more, setting appropriate deviation parameters in larger models is a Sisyphean labor.
The choice of colors, too, doesn’t just cause problems for the color blind. The eye is unable to differentiate quickly between shades of green and yellow. Therefore, when it comes to color coding, we always work with color scales between which the eye can rapidly distinguish between the different hues.
What are the alternatives to the traffic light paradigm I’ve criticized so heavily here? How can we still help managers orient themselves rapidly? Several parameter-free mechanisms that provide information to show the way, rather than simple stop signals, have already proven themselves in practice:
Automatic Navigation and Trumpet Curves
Navigation, a module within DeltaMaster, deals with the problem of multiple warning signals, and is of particular help when there are a lot of dimensions. It calculates the fastest route to the causes of a deviation, even through large, complex hierarchies.
The Trumpet Curve, another DeltaMaster module, depicts how much cumulated deviation is permissible without making the goal irrevocably unattainable. This is shown graphically with the aid of an increasingly narrow corridor. With more unfortunate constellations, it can predict early on in its path how far away from the target the actual values will end up.
Hypertree and Powersearch
Listing processes, that display effects in isolation or in combination, also do not require parameterization. These include the Hypertree and PowerSearch. They highlight above all where the controller should direct his attention in order to spot impending trouble in time.
Automatic Trend Calculation
Automatically calculated trend arrows, working in combination with the Sparkline cockpit we presented in Part II of this series, can also help the user quickly find his or her bearings. With their density of information and compact design, they directly show the trend of a series of values.
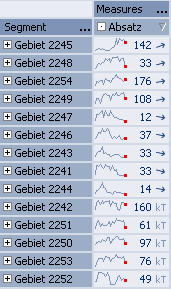
At the same time, the procedure does without the over-simplification that is standard in many daily newspapers. Here, even microscopically tiny changes to the share index are always shown at the same upward gradient of 45 degrees. If an index has improved by 0.03 percentage points, the arrow points straight up at the sky, and if it has worsened by 0.03 percentage points, the arrow points straight down.
Our mechanism provides geometrically correct mapping of the inclination of the trend line. The graphical scaling of the series sets the scale on which the trend arrow is based.
Whether a trend arrow is shown at all depends on the result of a statistical test: although essentially any series of numerical values can be mapped on to a trend line, we can only speak of a trend after a statistical check using the F-test has run successfully.
Our contribution to condensed and compact information design …
Read more:
Part I – Dashboard or trashboard?
Part II – Dashboard vs. sparklines
