Whether it’s hype or not, Big Data is the revival of data mining – and one that has been long overdue. Big Data is bringing new momentum into data-driven corporate cultures. But knowledge alone is not enough, which is why our battle cry is: Look. See. Do. So let’s get moving – so that the hype doesn’t turn into a big flop.
Fans of a data-driven corporate culture are trembling in fear and shaking with joy at the same time. The enthusiasm for data analysis has never been greater – but the expectations have never been higher as well. Back in 1995 and 2005 when Professor Peter Mertens was examining trends in business information systems, he emphasized the meaning of cumulative efforts, which are also a threat to good ideas if the enthusiasm diminishes too quickly. Dr. Gerald Butterwegge, my colleague both then and now, helped collect and analyze the data. Since Google didn’t exist at that time and the Internet was still in its infancy, analysis meant sitting in the library for days, leafing through newspapers, and keeping tallies on paper. Back then, I was doing research on data mining and, with my chosen topic, was smack-dab in the middle of the hype.
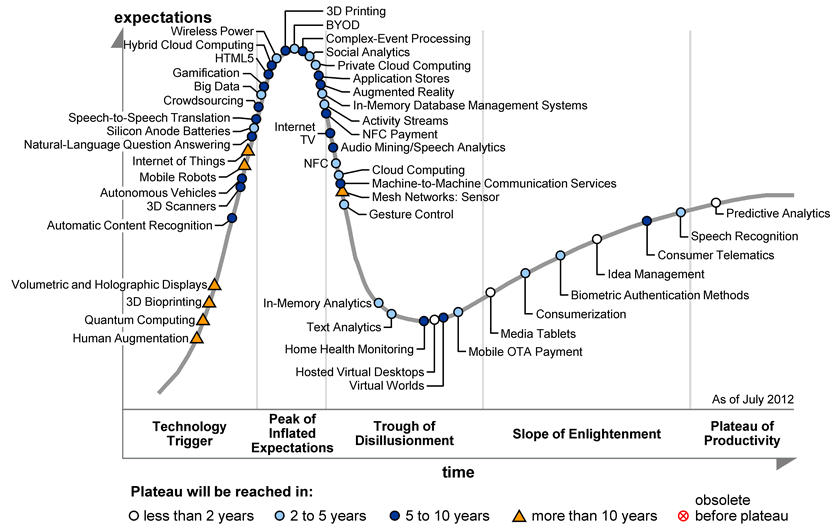
Is Big Data the revival of data mining? Has it reached the “plateau of productivity” or hit the “trough of disillusionment” as Gartner believes? I think that depends on our own actions. Source: Gartner.
Click to enlarge.
Mertens says: “Quietness of research” and continuous, long-term learning curves are necessary for a work to be successful. Oftentimes with hype topics, people tend to waste resources and pretend to see advancements that aren’t there while stable progress remains unnoticed.
If we interpret Big Data as the revival of data mining, we could already be in the productivity phase and contently go on making steps forward. But not so fast! One of Merten’s mottos in research was also that satisfaction is the enemy of progress. With that in mind, we will continue to carefully assess Big Data at the “peak of inflated expectations” and question how we can avoid the “trough of disillusionment”.
In the meantime, the euphoria is abounding – perhaps, in part, because Big Data has jumped from the headlines of IT publications into those of daily papers as well. A reader who just quickly skims through these articles could get the impression that people have more data than ever before, the data is filled with knowledge, and now there is even the software and hardware to automatically extract this knowledge. And all of this, of course, is completely game-changing.* Well, if software and hardware weren’t so incredibly helpful, there would be no reason for this blog in the first place. We would never criticize the progress in this area after all the efforts we have made, patents we have registered, and prizes we have won. Nevertheless, we feel that the challenge of Big Data has more to do with “data” than just merely being “big”.
Let’s put the phrases and phases aside for a moment. What does toiling over data really mean? What lessons have we learned over the past 20 years, and what recommendations can we make for the future? Which biases could be misleading in the Big Data hype? To answer these questions, let’s take a look at the following examples:
Case 1: People can use data to explain the world, but data cannot explain the world to people.
A large pharmaceutical company contacted us to take a look at its massive pool of outside sales data. We were primarily interested in the regional market shares for a handful of products and the visitation frequency of the field staff. In the pharmaceutical industry, it is generally assumed that the frequency in which its field staff visits doctors has a positive influence on the market share. As far as data was concerned, we were in the land of plenty: We could easily access and combine internal and external data as well as eliminate all of the usual obstacles related to format issues.
A first look at the data already told us what data mining and statistical methods later backed – namely, that there was no correlation between visitation frequency and market share! The IT experts and statisticians in the team were shocked and wondered how an entire industry could reward armies of field staff with provisions based on market share when the data clearly showed that there was no correlation between visitation frequency and market share. We first pondered if we should suggest a new commission model…but based upon what? The absolute number of visits – in other words, plain hard work? That all just didn’t sound feasible. Perhaps, the best thing to do was not to recommend anything. We were almost ready to admit defeat despite the best methodologies, fastest computers, and cleanest data from different sources – in other words, Big Data in its purest form. Only the results didn’t seem “big”.
The business experts in our team were able to calm the others. The solution is that if visitation frequency plays a role, the visitation frequency of the competition does as well – and that is why the company’s own market share can reflect the relative visitation frequency. If the company loses market share, the colleagues from the competition were there more often. Since they do not know the visitation schedules of their competitors, their own visitation frequency is a variable and by carefully examining their market share, they can help adjust it.
Due to these experiences, you could get a bit queasy if in the euphoria of Big Data, data will be declared all too joyously as a subject, ambassador, teacher, and interpreter – and then, at the end, data is declared to be the boss. Let managers stay in the driver’s seat – even when it comes to Big Data.
Scenario 2: Why the data that you need is often missing and you sometimes have to create good data yourself – despite the flood of information.
The cost-center controller of a company that accumulates mass amounts of garbage from many different sources was convinced that it could save costs by investing in more meticulous methods of recycling. He put on a pair of worker’s overalls, took a clipboard, and headed over to the early shift. His goal was to observe the manual waste separation process, calculate the time needed as well as tally the various types and quantities in order to create a statistical basis for his follow-up analyses. What he learned makes me yearn even more for information systems that bring executives even closer to the realities of everyday business. The workers assumed the worst and made it difficult for the controller to record statistics. They automatically assumed that someone wanted them to work faster and push their wages down. The means of their protest included blockades, mild forms of sabotage, and not so mild forms of harassment. The controller used all of the psychological tricks that he knew to influence a few of the instigators and, finally, convinced them to help. Things got better on the second and third day, and contentment started to spread over time due to the process improvements. After the data was collected, the follow-up analyses also revealed good news: one million euros per year in savings within the company.
I just love this story because it illustrates something very important. We should never forget that data in companies is the means – not the purpose. At the start of every data analysis, we should focus on the purpose for the analysis – and not the data.
Next time, we will examine a few more examples.
*Just one of many examples: “Big Data! Die nächste Revolution”, “Welt am Sonntag” from 2013-03-03, p. 52.
